Useful Metrics for Startups: Types and Uses
Updated: 2026-07-12
Useful startup metrics are the data points that allow you to evaluate a company’s real performance across its different dimensions: growth, retention, profitability, and customer satisfaction. Without clear metrics, decisions are made by intuition; with the right metrics, the team can learn from the business and adjust quickly. This article explains what types exist and how to use them.
Key takeaways
-
Metrics fall into two broad categories: performance metrics (general view) and area-specific KPIs.
-
Vanity metrics (followers, raw visits) don’t predict business success: prioritise actionable metrics.
-
The AARRR framework (Acquisition, Activation, Retention, Referral, Revenue) structures customer lifecycle analysis.
-
A high retention rate is the most reliable indicator that the product delivers real value.
-
Metrics must be chosen according to the startup’s stage: in early stage, prioritise product-market fit signals; in growth stage, prioritise acquisition efficiency.
What are useful startup metrics?
Useful startup metrics are figures or data points that let you evaluate company performance clearly and precisely. Unlike vanity indicators, which look good in a presentation but don’t guide decisions, actionable metrics are the ones that:
-
Reveal whether the product solves a real problem for users.
-
Indicate whether the acquisition channel is efficient.
-
Show whether the company can scale profitably.
The choice of metrics also evolves with the startup’s stage: in pre-product-market fit, qualitative signals matter more than quantitative ones; in post-PMF and growth, measured efficiency is critical.
Types of useful startup metrics
General performance metrics
They measure the aggregate progress of the company:
-
Revenue growth (MRR/ARR): monthly or annual recurring revenue, especially relevant in SaaS models.
-
Customer growth: number of new customers per period.
-
Retention Rate: percentage of users still active after a given period.
-
Churn rate: percentage of customers who cancel or stop using the product, the inverse of retention.
-
Conversion rate: percentage of visitors or leads who become paying customers.
Area-specific KPIs
KPIs measure concrete areas of the business:
-
CAC (Customer Acquisition Cost): average cost of acquiring a new customer. Always compare with LTV.
-
LTV (Lifetime Value): total expected revenue from a customer over the entire relationship with the company.
-
LTV:CAC ratio: David Skok[1] formulated the rule that LTV should be at least 3 times CAC for the business to be sustainable, though he later cautioned that the ratio only makes sense once the acquisition channel is repeatable.
-
NPS (Net Promoter Score): created by Fred Reichheld at Bain & Company, it measures customers’ willingness to recommend the product with a single question ("how likely are you to recommend us?"); the Bain Net Promoter System[2] documents the full method.
-
Time to Value (TTV): time it takes a new user to experience the product’s core value.
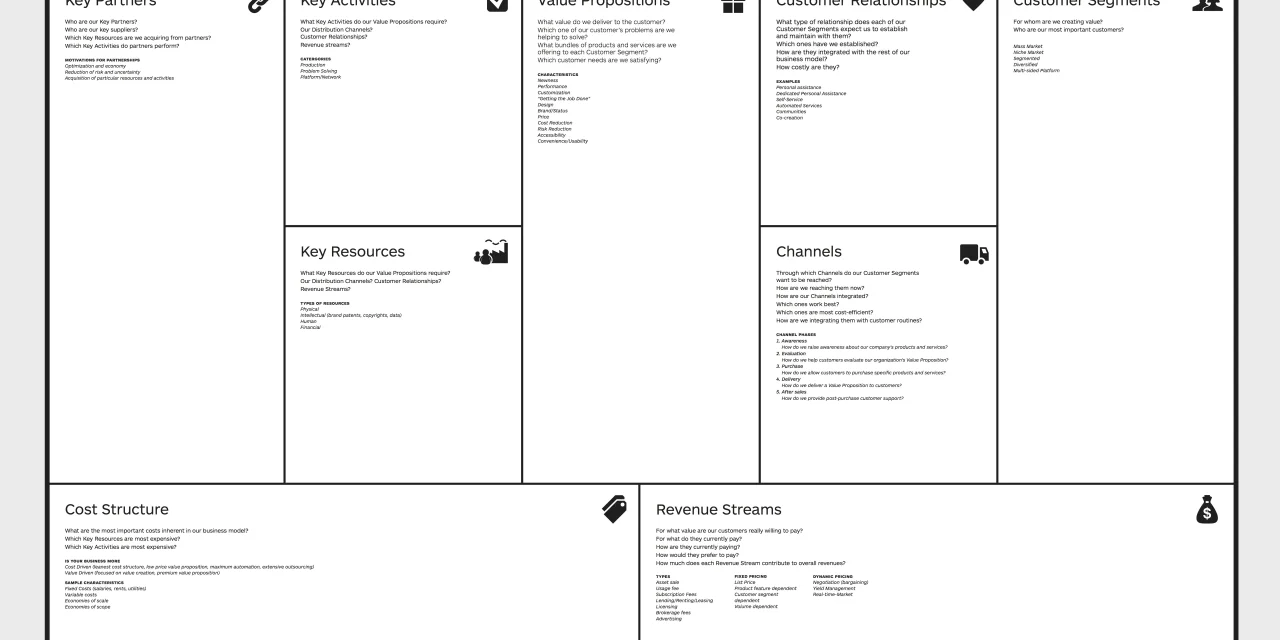
 Business Model Canvas: tool connecting value proposition, segments, channels, and financial metrics of a startup
Business Model Canvas: tool connecting value proposition, segments, channels, and financial metrics of a startup
The AARRR Framework (Pirate Metrics)
The AARRR framework, presented by Dave McClure (founder of 500 Startups) in his original «Startup Metrics for Pirates» deck[3], organises analysis into five customer lifecycle stages:
-
Acquisition: where do users come from? Measure channels, cost per click, CAC per channel.
-
Activation: do they have a good first experience? Measure onboarding completion rate, time to first key event.
-
Retention: do they come back? Measure DAU/MAU ratio, cohort retention curves.
-
Referral: do they recommend the product? Measure NPS, referral rate, viral coefficient.
-
Revenue: do they generate revenue? Measure MRR, ARPU, LTV.
Retention is the most honest metric: if users don’t come back, no acquisition or marketing tactic will solve the underlying product problem.
Using metrics to make decisions
Useful startup metrics inform decisions at three levels:
-
Product: a low activation rate signals onboarding problems or unclear value proposition. High support response time may indicate the product needs more self-service.
-
Market: conversion rate by channel reveals the most efficient ones. Churn segmented by industry or company size can indicate the ideal customer segment (ICP).
-
Team and operations: productivity per employee, development cycle time, or support ticket cost guide hiring and process decisions.
They also inform financial health: a high retention rate, combined with LTV above 3x CAC, is the most reliable signal that the business can scale.
For teams applying agile methodologies and product design, the post on Figma for collaborative prototyping covers how metrics-driven design integrates with the development process. And to translate these metrics into quarterly team goals, the post on OKR methodology explains how to turn a KPI like churn or LTV:CAC into an objective with measurable key results.
How to select the right metrics
Not all metrics are equally relevant at each stage. An orientation guide:
-
Seed stage (pre-PMF): prioritise activation metrics and early cohort retention, qualitative signals that the product solves something real.
-
Early growth stage (post-PMF): add CAC, LTV, and channel efficiency. Find the repeatable and scalable acquisition channel.
-
Scale stage: optimise LTV:CAC ratio, operational efficiency, and revenue expansion metrics (net revenue retention, upsell rate).
Avoid the trap of measuring too many things at once. A dashboard with 40 metrics generates noise; a dashboard with 5-7 key metrics generates focus.
Conclusion
Useful startup metrics are not an end in themselves but an instrument to learn faster. The goal is not to have the best dashboard but to make better decisions in less time. Prioritising retention, LTV:CAC, and activation rate over vanity metrics is the starting point of any data-driven culture.
This article is also available in Spanish.