Applying graph RAG to a real product
Actualizado: 2026-05-03
Over the past year and a half, the idea of enriching traditional RAG with graph structures has moved from a lab topic and landed in real products. The push came partly with the publication of GraphRAG by Microsoft Research in mid-2024, but the pattern has evolved well beyond that: today there are lightweight variants (LightRAG, HippoRAG), open implementations running on Neo4j or Memgraph, and templates ready to try over a weekend. The market is mature enough to start asking when it pays off and when it doesn’t.
This post is not an implementation tutorial: it’s a reflection on the pattern, when it adds real value over classic vector RAG, and which design decisions separate a useful implementation from over-engineering. For broader RAG production context, the post on RAG patterns in production is a good starting point.
Key takeaways
- GraphRAG excels when data has explicit semantic relationships that vector embeddings don’t capture well.
- The real advantage is multi-hop reasoning: answering questions that require chaining multiple relationships.
- The overhead of building and maintaining the graph is only justified when the domain is stable and relationships are rich.
- The most common mistakes: building the graph over flat data without real relationships, and underestimating maintenance cost.
- For most use cases, vector RAG with reranking remains the correct solution.
What the graph adds over vector RAG
Classic vector RAG converts documents to embeddings, stores them in a vector database, and retrieves those most similar to the query. It works well when the question has an answer locatable in one or few text fragments. Its limits appear when the answer requires combining information dispersed across multiple sources, or when relationships between concepts matter as much as each concept’s content.
The graph adds a layer of explicit structure over those relationships. Instead of searching for “fragments similar to the query,” you can navigate the graph to chain relationships: “which products are affected by this supplier change” or “which design decisions were made in dependency of this requirement.” This form of reasoning is called multi-hop and is where the graph has a clear advantage over pure vector.
The most practical difference: vector embedding captures semantic similarity; the graph captures structure and dependency. For questions like “describe X,” embedding usually suffices. For questions like “how is X related to Y given the context of Z,” the graph can add precision that vector alone doesn’t have.
When the graph pays off
The graph adds value when several conditions hold:
Data has rich, explicit semantic relationships. A technical documentation base with component dependencies, a medical knowledge base with drug-disease-symptom relationships, a contract graph with linked parties and clauses. When the domain is flat (independent blog articles, standalone FAQs), the graph adds complexity without benefit.
Typical questions require multi-hop reasoning. If your users mainly ask things locatable in a single text fragment, vector RAG is cheaper and sufficient. If questions traverse multiple related entities, the graph allows navigating those connections more reliably than vector retrieval.
The domain is relatively stable. Building the graph has a significant upfront cost (entity extraction, reference resolution, relationship schema definition). If data changes very frequently or the domain is very open, the cost of keeping the graph updated can exceed the benefit.
You have capacity to maintain it. The graph is not an index that automatically regenerates with new documents; it requires update pipelines, consistency validation, and often human review of extracted relationships.
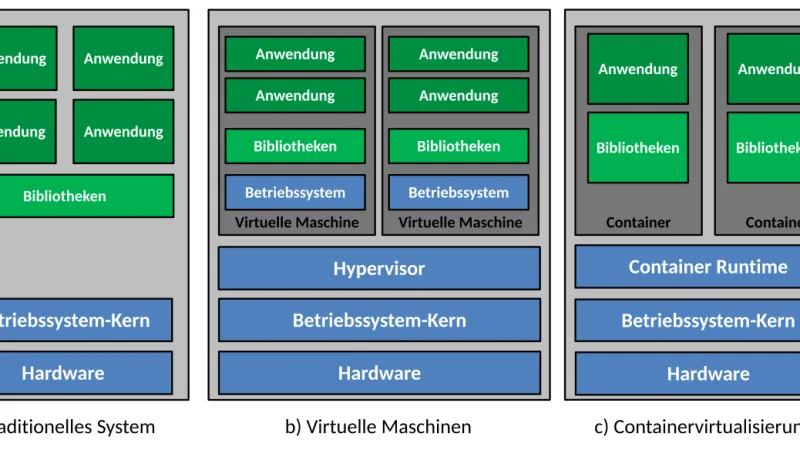
How it’s assembled in practice
The basic GraphRAG architecture has four components:
- Extraction: pipeline processing source documents and extracting entities and relationships. Can be hybrid (LLM for flexible extraction + rules for known structured relationships). The quality of this step determines the quality of everything else.
- Graph: graph database (Neo4j, Memgraph, Kuzu for lightweight cases) where nodes and relationships are stored with their properties. Node embeddings can live here or in a separate vector database.
- Retrieval: combination of vector search (to find nodes most relevant to the query) and graph traversal (to expand context through relationships). Microsoft’s GraphRAG uses communities; LightRAG uses local and global traversal.
- Generation: the LLM generates the answer using recovered nodes and relevant relationships as context.
The most underestimated step is extraction. Many implementations fail because they extract low-quality or incomplete relationships, and the resulting graph doesn’t reflect the domain’s real structure. Spending time validating extraction on a representative sample before building the full graph is time well invested.
Mistakes that repeat
The most common mistakes when taking GraphRAG to production:
Building the graph over data without real relationships. If your documents are independent blog articles or unstructured support tickets, extracting a graph over them is an expensive exercise with little return. The graph only adds value when the relationships it extracts are semantically meaningful.
Underestimating maintenance cost. A graph built once and not maintained quickly becomes stale. Every new document, every domain change, requires graph updates and possibly reconciliation with existing nodes. Without an automated update pipeline, the graph is an asset that ages.
Not evaluating against the vector baseline. Before investing in GraphRAG, measure simple vector RAG precision on the same question set. In most cases the quality difference for simple questions is marginal, and graph implementation and maintenance cost isn’t justified. The graph is justified when there are multi-hop questions for which the vector consistently fails.
Using the graph for everything instead of as a hybrid component. The most robust production pattern combines vector and graph: vector retrieves relevant entry points and the graph expands context through relationships. Completely replacing vector with graph is usually a mistake.
My read
GraphRAG is not a universal RAG improvement; it’s a specific tool for domains with rich relational structure. Vector RAG with reranking remains the correct solution for most use cases. The graph adds value when the domain justifies it, and honest evaluation of when it does is the most important step before starting.
For those working with products already using embeddings and vector databases, the post on pgvector for semantic search and the analysis of vector databases offer complementary context for deciding when adding the graph layer makes sense.