eBPF for Continuous Profiling: Parca and Beyla
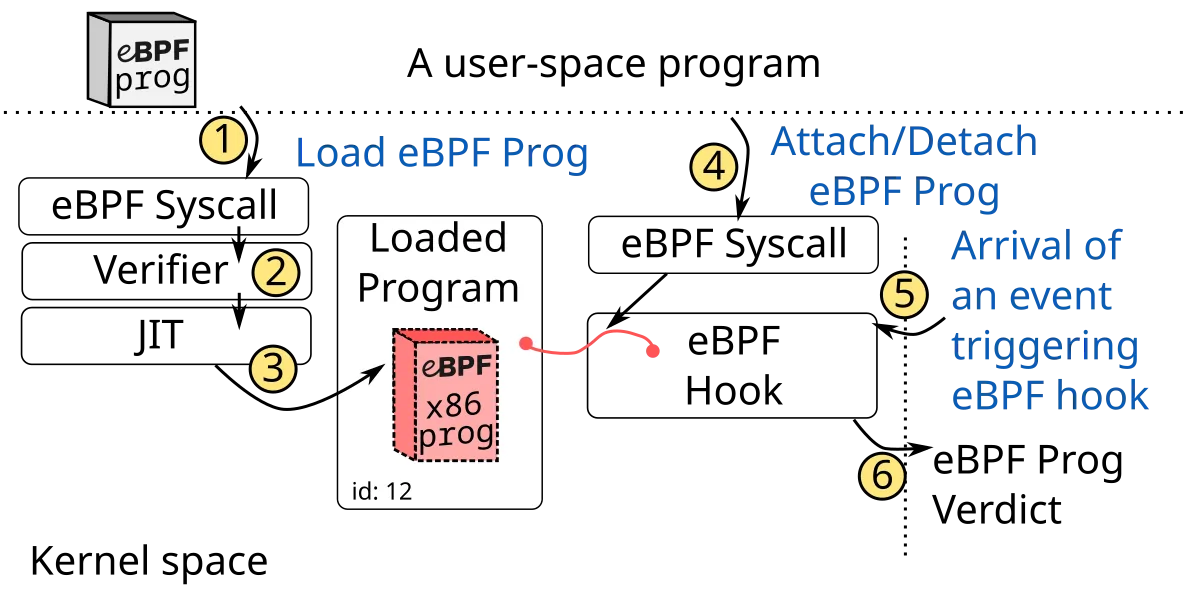
Table of contents
- Key takeaways
- The problem continuous profiling solves
- Parca: cluster-wide CPU profiling
- Beyla: HTTP and gRPC auto-instrumentation
- Pyroscope: deep per-language profiling
- Grafana: correlation between profiles, traces, and metrics
- Real overhead of the stack
- Compatibility and requirements
- Conclusion
- Sources
Updated: 2026-07-07
eBPF-based continuous profiling transforms how I investigate performance problems. Instead of manually instrumenting each application or resorting to pprof at incident time, an agent loaded into the Linux kernel generates CPU flame graphs for all node processes constantly, with real overhead under 1%. The stack I use in 2024 combines three tools with complementary roles: Parca[1] for cluster-level CPU profiling, Grafana Beyla[2] for HTTP/gRPC auto-instrumentation without code changes, and Grafana Pyroscope[3] for deep per-language profiling.
Key takeaways
-
Parca deploys a DaemonSet that generates CPU profiles for all node processes via eBPF without touching applications.
-
Beyla automatically instruments HTTP and gRPC requests in the kernel, generating RED metrics and OpenTelemetry traces without SDK.
-
Pyroscope complements with more detailed language-level profiling for specific critical services.
-
Combined overhead of the full stack is 1-2% CPU and 1-3 GB RAM per node.
-
Correlation between Parca profiles and Tempo traces in Grafana lets you go from "this trace took 800 ms" to "in that interval, 60% of CPU went to GC".
The problem continuous profiling solves
Traditional ad-hoc profiling has two structural problems. The first is that the problem is gone when you arrive: most performance regressions are intermittent or only manifest under specific load. A latency spike at 3am that does not reproduce during analysis generates unresolved tickets.
The second is that manual instrumentation has high friction cost: adding pprof to a Go service, configuring py-spy for Python, or installing JVM agents requires engineering time, change approvals, and in some cases service restarts.
eBPF solves both: the agent is always active, capturing data before, during, and after the incident, and requires no application modifications. The flame graph for the exact moment of the incident always exists, because profiling never stopped.
Parca: cluster-wide CPU profiling
Parca installs two components in Kubernetes:
-
Parca Agent (DaemonSet): one process per node using eBPF to capture call stacks from all processes at a configurable frequency (default: 19 Hz).
-
Parca Server: stores profiles, indexes them by service, enables real-time queries and historical comparisons.
helm install parca parca/parca --namespace monitoring
helm install parca-agent parca/parca-agent
  --namespace monitoring
  --set "config.relabelings[0].sourceLabels[0]=__meta_kubernetes_pod_label_app"
  --set "config.relabelings[0].targetLabel=service_name"
What makes Parca different from traditional profilers is stack unwinding without frame pointer. For compiled languages like Go, Rust, and C++, Parca uses DWARF debug info to reconstruct the full call stack even when the compiler has eliminated frame pointers for optimisation. For interpreted languages like Python and Node.js, Parca can capture interpreter frames.
Beyla: HTTP and gRPC auto-instrumentation
Grafana Beyla operates at a different layer from Parca. Where Parca captures CPU time, Beyla intercepts network system calls in the kernel to generate:
-
RED metrics (Rate, Errors, Duration) for each HTTP/gRPC service automatically.
-
OpenTelemetry traces sent directly to Grafana Tempo or any OTLP backend.
-
Service graphs showing dependencies between services based on observed real traffic.
This works without modifying application code, without adding SDKs, without restarting services:
helm install beyla grafana/beyla
  --set env.BEYLA_AUTO_INSTRUMENT_TARGET="*"
  --set env.OTEL_EXPORTER_OTLP_ENDPOINT="http://tempo:4317"
Beyla uses eBPF uprobes and kprobes to intercept TLS calls and socket-related system calls. For Go, it can even detect when net/http is used directly without TLS and pull the HTTP headers out of the process memory buffer before they get encrypted. I have covered Beyla’s auto-instrumentation in more depth, with step-by-step setup, in Grafana Beyla: Auto-Instrumentation Without Touching Code.
Compared with OpenTelemetry using a manual SDK: Beyla covers 80% of the value at 0% of the instrumentation overhead. The cases where a manual SDK is still needed are trace-context propagation across messaging systems and enriching spans with business-specific metadata.
Pyroscope: deep per-language profiling
Grafana Pyroscope (originally independent, now part of Grafana Labs) is the most detailed profiling layer in the stack. Where Parca uses eBPF for OS-level capture, Pyroscope has native per-language agents that can capture more specific information:
-
For Go: goroutine counts, heap allocations, mutex contention, not just CPU time.
-
For Python: line-level profiling, memory allocations, coroutines.
-
For JVM: JIT compilation overhead, GC pause detail, object allocation by type.
-
For Rust: profiling with
perfannotations or via Parca/eBPF.
The typical usage pattern is Parca for broad coverage and Pyroscope with a native agent only on the most critical or hardest-to-debug services:
# Pyroscope in Python: language agent for extra detail
import pyroscope

pyroscope.configure(
    application_name="my-python-service",
    server_address="http://pyroscope:4040",
    sample_rate=100,
    detect_subprocesses=False,
    oncpu=True,
    gil_only=False,
    enable_logging=True,
)
Grafana: correlation between profiles, traces, and metrics
Integration of the full stack in Grafana is where compound value emerges. With Grafana Tempo for traces, Prometheus for metrics, and Parca/Pyroscope for profiles, Grafana allows (I go into more examples in Parca, Beyla and Grafana: A Sidecar-Free Observability Stack):
-
Identify a slow trace in Tempo.
-
Click on the time interval of that trace.
-
View the Parca flame graph corresponding to that exact interval.
-
Identify which specific function consumed most CPU during that trace.
That jump, from "the request took 800 ms" to "60% of that time was in this serialisation function", is impossible without temporal correlation between profiles and traces. It is the modern version of what perf + trace used to do by hand, at a real cost in engineering time, except now it is recorded without anyone having to go dig for it.
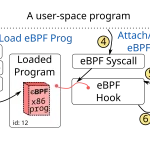
 eBPF program lifecycle diagram: loading into the kernel, safety verification by the verifier, and JIT compilation, the technical basis on which Parca and Beyla capture profiles and traces without instrumenting applications
Real overhead of the stack
-
Parca Agent: 0.5-1% CPU per node. ~200 MB RAM per agent.
-
Beyla: 0.3-0.8% CPU for medium-traffic services.
-
Parca Server: typically 1-2 GB RAM + disk storage.
Total overhead of 1-2% CPU and 1-3 GB RAM per node is acceptable for most production clusters where nodes have 16-32 GB RAM. For nodes under severe resource constraints (industrial edge computing, for example), the overhead can matter and should be assessed case by case.
LLM application observability adds a particular dimension here: vLLM’s GPU overhead shows up in Parca’s CPU profiles whenever there is a host-CPU bottleneck (serialisation, preprocessing), which complements vLLM’s native GPU metrics.
Compatibility and requirements
Stack requirements:
-
Linux kernel 5.8+ for all needed eBPF features. Kernels 5.15+ recommended.
-
BTF (BPF Type Format) enabled in kernel: available by default in modern distributions.
-
Kubernetes 1.24+ for the latest Parca and Beyla versions.
For distributions with older kernels, common in enterprise environments running RHEL 7 or CentOS 7, the eBPF stack is not available. In those environments, the fallback is Pyroscope with native language agents and no eBPF component.
Conclusion
eBPF-based continuous profiling eliminates the most frustrating operational friction of performance observability: the impossibility of profiling what already happened. Parca, Beyla, and Pyroscope, integrated in Grafana, provide full coverage of CPU, traces, and language-level profiles with acceptable overhead and without modifying applications. The result is that performance problems stop being forensic investigations with incomplete evidence and become analyses with temporally exact data of what occurred. Personally, that is the part of the whole stack that gives me the most peace of mind: I no longer depend on an incident repeating itself to be able to explain it.
This article is also available in Spanish: eBPF para profiling continuo: Parca y Beyla.