Helicone is an open-source LLM observability platform you integrate by changing a single line: your client's base URL. It logs cost, latency and tokens for every call, adds caching and rate limiting, and you can self-host it with Docker. It is Apache-2.0 and has nearly 6,000 GitHub stars, though since March 2026 it sits in maintenance mode.
Langfuse is an open-source platform to observe, debug and evaluate AI applications and agents. You can self-host it with Docker Compose on Postgres, ClickHouse, Redis and S3 storage, and its Python SDK, built on OpenTelemetry, captures traces, spans and generations with their cost and latency. This guide explains how to deploy it and instrument an agent.
After fourteen months testing AI-integrated DevOps tools across several teams, the stack that stays is small: Claude Code, Cursor, and Aider for code; PagerDuty AIOps, Datadog Bits AI, and Grafana Assistant for alert triage; and OpenTofu with OPA for infrastructure generation bounded by policy rules.
AI agents fail in production, and what matters is how you respond in the first twenty minutes. This runbook covers severity classification, isolating before investigating, purging contaminated memory, communicating without inventing facts, and turning every incident into a regression test before closing it as done.
Reliable agents come from measurement, not from better models or prompts. A production agent evaluation setup starts with a golden dataset of 30 to 200 cases, split roughly 60 percent normal usage, 30 percent edge cases and 10 percent adversarial, and it never uses the same model as both worker and judge.
A selection of postmortems published between 2025 and 2026 by teams running AI systems in production reveals repeated patterns: guardrail failures, silent model drift, hidden vendor dependency, and a collection of near-misses worth distilling.
Among the AI features in SRE dashboards, alert correlation is the one with demonstrated value: it groups dependent alerts from a single incident, cutting time to acknowledge and fatigue during a crisis. Automatic incident summaries help too. The real problem was never a shortage of information, it was separating signal from noise and correlating scattered symptoms.
After a decade of Prometheus, three years of consolidation around OpenTelemetry, and the open stack now mature with Grafana, Loki, and Tempo, concrete recommendations for teams starting or reviewing their observability layer: what fits, what is excess, and what to avoid.
Agents that chain calls to models, tools and memory are hard to debug without instrumentation designed for them. After a long year running agents in production, I cover what to measure first, which standards are consolidating, and which costly mistakes are avoided by getting the traces right from the start.
The combination of Parca for continuous profiling, Beyla for eBPF auto-instrumentation, and Grafana as the visualisation layer delivers deep observability without touching code. A look at how the three pieces fit together and where the limits still show.
Continuous profiling with eBPF samples every process's execution stack every few milliseconds without touching the code, then stores the history so you can compare last week's performance with today's. The cost measured in production runs between 1% and 3% of CPU, and it pays off most in databases, API gateways and high-concurrency services.
Seven years on, the Site Reliability Workbook still earns its place in small teams through a handful of patterns: SLOs set slightly below what you already achieve, so the error budget is real and negotiable; a 28 to 30 day rolling window; and blameless postmortems that drop punishment while keeping accountability.
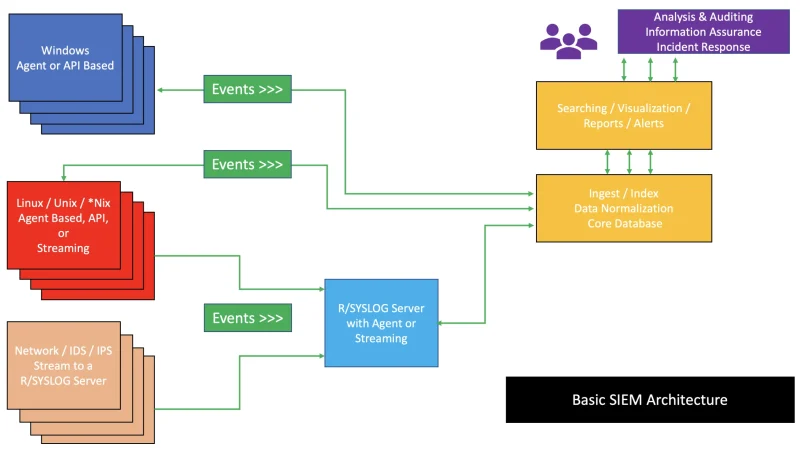
Two years after Zero Trust stopped being a marketing word, it is worth looking at how it connects with the SIEM teams run day to day. A look at useful signals, avoidable noise, and the decisions that actually change security posture.
Vector is the Datadog observability agent, written in Rust with its own transformation language VRL. Typically 30-100 MB memory, handling logs, metrics, and traces from dozens of sources. The right choice when pipelines are too complex for Fluent Bit and a modern alternative to Logstash.
eBPF-based continuous profiling captures CPU flame graphs for every process on a Linux node around the clock, without instrumenting code or restarting services, at under 1% overhead. Parca covers the whole cluster, Beyla adds automatic HTTP/gRPC metrics and traces, and Pyroscope brings native per-language detail to the most critical services.
LLM applications need three distinct observability planes: prompt and response traces for debugging hallucinations, per-token and per-feature cost tracking, and response quality evaluation. Mature tools like Langfuse, LangSmith, and Helicone cover all three planes with specific instrumentation.
OpenTelemetry declared logs signals stable in July 2024. The third pillar of modern observability finally joins metrics and traces under a single protocol and a shared data model.
Parca is a continuous profiling tool based on eBPF that samples CPU usage across an entire Kubernetes cluster around the clock, without instrumenting application code and with under 1% overhead. It catches performance regressions before production and makes flame graphs practical for everyday debugging.
cAdvisor is still embedded in kubelet and covers surface metrics, but falls short for production Kubernetes. The modern minimum stack pairs it with kube-state-metrics, node-exporter, Prometheus, and Grafana as a base, eBPF for deep network and syscall visibility, and OpenTelemetry for application context.
Fluent Bit is the CNCF's lightweight log collector: a ~1.5 MB C binary that rarely tops 30 MB of memory in production. It beats Promtail, Vector, and Filebeat when several destinations or resource-constrained nodes are in play, thanks to a pipeline of inputs, parsers, filters, and outputs that stays easy to reason about and debug.
SLOs and error budgets only work when the budget drives real decisions. A feature freeze that triggers on exhaustion, deploy velocity that adjusts to consumption. With two or three well-chosen SLIs, a clear freeze policy, and simple tools like Prometheus with Sloth, a team can sustainably balance velocity and reliability in production.
Loki indexes only labels, not log content, which cuts storage costs dramatically compared to Elasticsearch. The main production risk is cardinality explosion each unique label-value combination generates a stream that inflates the index and slows queries. Separating read and write paths ensures a heavy query cannot saturate ingestion.
Falco is a graduated CNCF project that hooks the Linux kernel via eBPF and detects syscall anomalies in real time without instrumenting applications. Deployed as a DaemonSet on Kubernetes, it emits JSON events and requires a triage process to deliver value. In production, alert fatigue is the most common operational pitfall.
eBPF is a Linux kernel technology that lets you load and run verified, high-performance programs without recompiling the kernel or rebooting the system. It runs safely inside a virtual machine in the kernel and underpins tools such as Cilium, Pixie, Falco, and Tetragon for real-time tracing, networking, and security.
PostgreSQL 16, released in September 2023, adds logical replication from a standby, the pg_stat_io view for breaking down I/O by operation type and context, and parallel FULL OUTER JOIN support. Upgrading from 15 is straightforward; 13 loses support in November 2025, so plan the update soon.
The Grafana stack combines three open source projects: Loki for logs, Tempo for traces, and Mimir for metrics. All three keep data in object storage (S3/GCS) with a minimal index instead of indexing everything like Elasticsearch, which cuts cost sharply at high volume and lets you correlate metric, log, and trace from a single Grafana panel.
OpenTelemetry is the CNCF project, graduated in May 2026, that unifies logs, metrics, and traces under one SDK and the OTLP protocol, without locking you into a single backend. Traces have been stable since 2021 and metrics since 2023; logs are still maturing, but already worth adopting on new projects.
Kubernetes 1.28 introduces native sidecar containers in alpha via KEP-753: adding restartPolicy Always to initContainers ensures correct startup and shutdown ordering. It fixes Jobs that never terminate. Istio, Linkerd, and observability agents like Fluent Bit are the primary beneficiaries.
To write Prometheus alerts that won't get ignored, alert on customer-observable symptoms (latency, error rate, saturation) instead of internal causes like CPU or memory, define SLOs with multi-window burn rate to scale severity, add a watchdog alert that confirms the system is still alive, and review the signal-to-noise ratio every quarter.
Pixie uses eBPF to automatically instrument Kubernetes clusters without modifying application code. A per-node agent captures HTTP, gRPC, SQL, and Redis traffic at the kernel level, exposing service maps, CPU profiles, and SQL traces within minutes. It complements Prometheus for reactive diagnosis with no sidecars or redeploys.
eBPF (Extended Berkeley Packet Filter) is a Linux kernel technology that runs verified programs directly inside the kernel, with no modules and no source-code changes. The kernel verifier rejects any unsafe program before it runs, letting teams monitor system calls, network traffic, and I/O at a much lower CPU cost than traditional external probes.
5 min2444.3
We use first- and third-party cookies to analyze site traffic. You can accept them, reject them, or configure your choice.
Learn more about cookies
Cookie preferences
NecessaryEssential for the site to work. Always on.
AnalyticsHelp us understand how the site is used (Google Analytics).