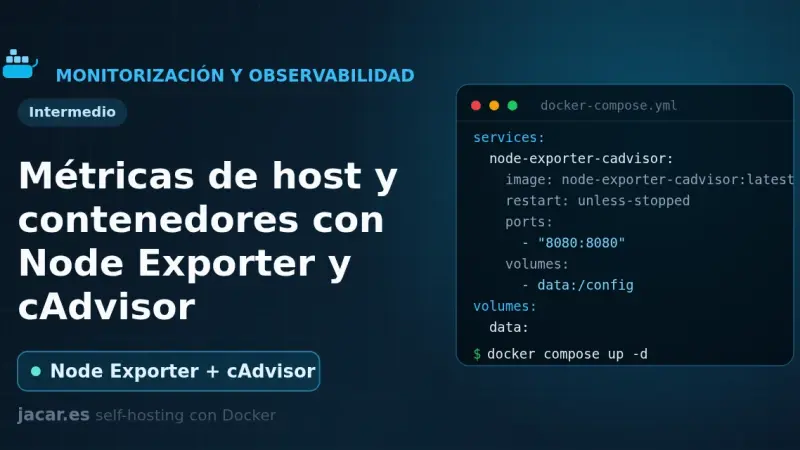
Node Exporter and cAdvisor are the two exporters that feed Prometheus: the first collects host metrics (CPU, RAM, disk and network) on port 9100, and the second collects per-container metrics on port 8080. This guide brings both up with a single docker-compose.yml, connects them to Prometheus and explains which metrics to watch.
Los cuadros de mando con IA llevan un par de años prometiendo detección de anomalías mágica y causa raíz automática. La realidad es más modesta pero también más útil, si se sabe separar el ruido del valor real. Repaso honesto de qué funciona y qué no.
After a decade of Prometheus, three years of consolidation around OpenTelemetry, and the open stack now mature with Grafana, Loki, and Tempo, concrete recommendations for teams starting or reviewing their observability layer: what fits, what is excess, and what to avoid.
A badly configured Alertmanager turns every incident into noise: a single unrouted receiver ends with an ignored Slack channel within a week. This article covers, on Alertmanager 0.27 and Prometheus 2.54, how to design the routing tree, inhibition rules, silences and on-call rotations to curb alert fatigue without losing real incidents.
cAdvisor is still embedded in kubelet and covers surface metrics, but falls short for production Kubernetes. The modern minimum stack pairs it with kube-state-metrics, node-exporter, Prometheus, and Grafana as a base, eBPF for deep network and syscall visibility, and OpenTelemetry for application context.
SLOs and error budgets only work when the budget drives real decisions. A feature freeze that triggers on exhaustion, deploy velocity that adjusts to consumption. With two or three well-chosen SLIs, a clear freeze policy, and simple tools like Prometheus with Sloth, a team can sustainably balance velocity and reliability in production.
To write Prometheus alerts that won't get ignored, alert on customer-observable symptoms (latency, error rate, saturation) instead of internal causes like CPU or memory, define SLOs with multi-window burn rate to scale severity, add a watchdog alert that confirms the system is still alive, and review the signal-to-noise ratio every quarter.
5 min2323.9
We use first- and third-party cookies to analyze site traffic. You can accept them, reject them, or configure your choice.
Learn more about cookies
Cookie preferences
NecessaryEssential for the site to work. Always on.
AnalyticsHelp us understand how the site is used (Google Analytics).