How to Install Dashy with Docker
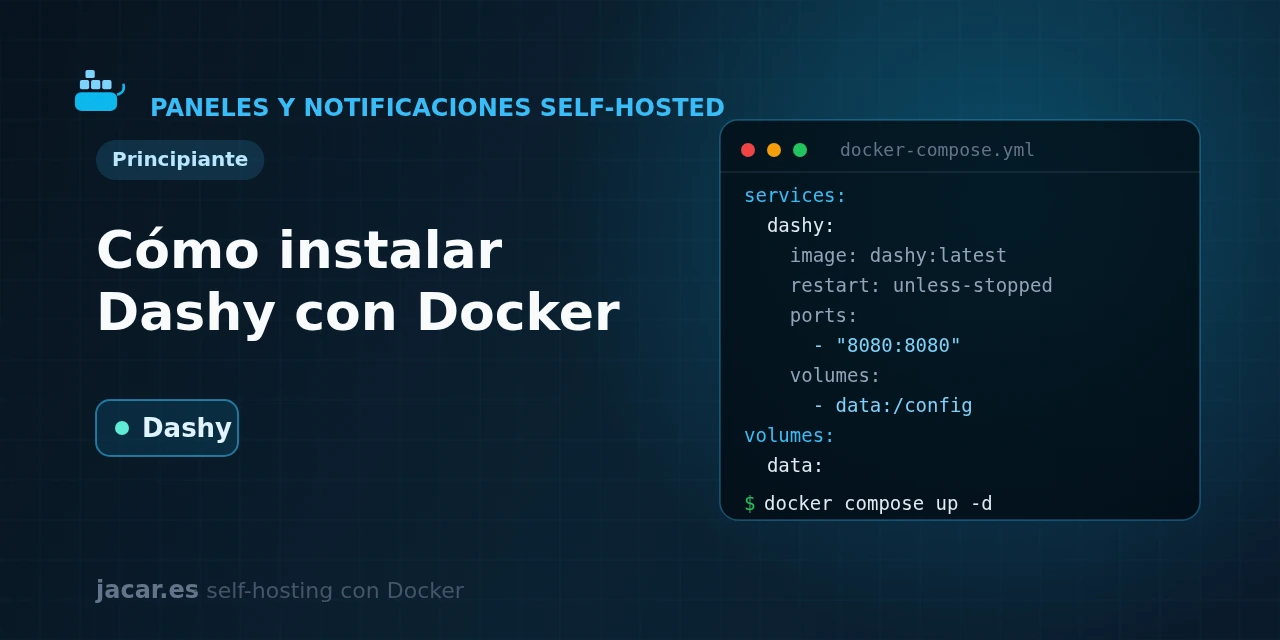
Table of contents
- Key takeaways
- What is Dashy and what is it for?
- What does the docker-compose.yml for Dashy look like?
- How do you configure the conf.yml file?
- How do status checking and widgets work?
- How do you change themes and icons?
- Frequently asked questions
- How is Dashy different from Homarr or Heimdall?
- Does Dashy need a database?
- How do I back up my Dashy configuration?
- Conclusion
- Sources
Dashy, an open-source self-hosted dashboard, turns the tangle of IP addresses and ports in your homelab into a single start page, with live status checking, widgets and a visual editor. In this guide you bring it up with a single docker-compose.yml file, learn to structure its conf.yml file, enable status checking for each service and change its theme and icons. By the end you will have your own panel on port 4000 that acts as the front page to your whole infrastructure. The same explanation is available in Spanish.
Key takeaways
- Dashy is an open-source, self-hosted start page, written in Vue, with more than 25,900 stars on GitHub and an MIT licence.
- It ships as the official image
lissy93/dashy(also onghcr.io/lissy93/dashy); the latest stable release is 4.4.0, from July 2026. - All its configuration lives in a single
conf.ymlfile mounted at/app/user-data, with four root sections:pageInfo,appConfig,sectionsandpages. - The container serves the web UI on port 8080; the image includes its own
healthcheck(node /app/services/healthcheck.js) that Docker runs every 90 seconds. - Always pin a specific version such as
lissy93/dashy:4.4.0; using the:latesttag exposes you to behaviour changes without warning.
What is Dashy and what is it for?
Dashy is an open-source application that gives you a start page for your home server or homelab. Instead of memorising that Jellyfin is on port 8096 and Portainer on 9000, you group all your services into cards arranged by sections, each with its icon, its description and a direct link. It is built with Vue. Three things set it apart from any old link panel: status checking of each service, a broad catalogue of widgets and a visual editor that writes the configuration for you.
The underlying difference from lighter alternatives is that Dashy is not just a grid of shortcuts. Each item can probe its service and show green or red depending on whether it responds, so the panel itself warns you about a downed container. It also ships widgets that display live information (the weather, system status, RSS, stats from your own services), an integrated search and keyboard shortcuts. All of that puts it a rung above a simple bookmark manager.
Dashy competes in the same category as other panels in this path. If you want a more modern drag-and-drop editor, look at Homarr; if you prefer something minimal based on the LinuxServer image, there is Heimdall. Dashy sits in the middle: more powerful than Heimdall, more configurable by text than Homarr.
What does the docker-compose.yml for Dashy look like?
Dashy needs very little: the image and a directory to keep its conf.yml. Here is a complete docker-compose.yml, with the version pinned, a bind mount for the user-data folder (where the configuration lives), the port published only on the machine itself and the healthcheck the image ships with:
services:
  dashy:
    image: lissy93/dashy:4.4.0
    container_name: dashy
    restart: unless-stopped
    ports:
      - "127.0.0.1:4000:8080"
    volumes:
      - ./user-data:/app/user-data
    environment:
      NODE_ENV: production
    healthcheck:
      test: ["CMD", "node", "/app/services/healthcheck.js"]
      interval: 90s
      timeout: 10s
      retries: 3
      start_period: 30s
Two details are worth pausing on. The container serves the web UI on port 8080, but here we publish it as 127.0.0.1:4000:8080: on the outside it lives on 4000 (Dashy’s historical convention) and is reachable only from the server itself. The ./user-data:/app/user-data mount is a bind mount: it links a folder on your disk to the container’s, so your conf.yml survives any recreation of the container. If you want to understand when to use a bind mount and when a named volume, we cover it in the guide on Docker volumes and bind mounts.
Create the folder and start the stack:
mkdir -p user-data
docker compose up -d
docker compose ps
docker compose logs -f dashy
On the first boot, if the user-data folder is empty, Dashy generates a sample conf.yml. Open http://127.0.0.1:4000 and you will see the panel with the default configuration, ready for you to make it your own.
How do you configure the conf.yml file?
Everything in Dashy is controlled from a single YAML file, conf.yml, mounted inside the container at /app/user-data/conf.yml. It has four top-level sections: pageInfo (title, description and header links) and appConfig (global settings such as the theme or status checking). The other two are sections (the groups of cards, where you will spend most of your time) and pages (to split the panel across more than one page). A minimal conf.yml with two sections looks like this:
pageInfo:
  title: My homelab
  description: Service panel
appConfig:
  theme: colorful
  statusCheck: true
  statusCheckInterval: 60
sections:
  - name: Media
    icon: fas fa-photo-video
    items:
      - title: Jellyfin
        url: http://192.168.1.10:8096
        icon: hl-jellyfin
        statusCheck: true
  - name: Management
    icon: fas fa-cogs
    items:
      - title: Portainer
        url: http://192.168.1.10:9000
        icon: hl-portainer
Each items entry accepts a title, the destination url, an icon and optional fields such as description, target (to open in a new tab) or tags (for the search box). You do not need to restart the container after each change: when you save the file, Dashy detects the change and reloads the configuration. And if you would rather not touch YAML, the interface itself has a visual editor (the pencil icon) that writes the changes to conf.yml for you. To serve Dashy with a domain and HTTPS, place it behind a reverse proxy such as Traefik.
How do status checking and widgets work?
Dashy’s flagship feature is status checking (statusCheck). When you enable it, Dashy sends an HTTP request to each service and paints a green indicator if it responds and a red one if it does not. You turn it on globally by setting statusCheck: true in appConfig, or service by service on each item.
The interval is controlled by statusCheckInterval, in seconds (if it is 0, it only checks on page load). For specific cases you can fine-tune it with statusCheckUrl, statusCheckAcceptCodes or statusCheckAllowInsecure.
The second pillar is widgets. Beyond the link cards, a section can contain widgets that display live data: the weather, the server’s own CPU and RAM usage, an RSS feed, container status or metrics from services you already run. They are declared just like items, inside a section:
sections:
  - name: System
    widgets:
      - type: cpu-usage
      - type: memory-usage
      - type: weather
        options:
          apiKey: YOUR_KEY
          city: Seville
With these two pieces, Dashy stops being a list of bookmarks and becomes a real board: at a glance you know which services are up and how the server is doing. For deeper monitoring of historical metrics, combine it with a dedicated stack such as Prometheus and Grafana; Dashy is the front page, not the full observability system.
How do you change themes and icons?
Dashy ships with more than a dozen built-in themes that you switch on the fly from the panel itself (settings menu, top right) or fix in conf.yml with the theme key. You can define one theme for the day and another for the night with dayTheme and nightTheme, and tweak specific colours with customColors. If you want to go further, customCss lets you inject your own CSS rules.
Icons are the other big customisation point, and Dashy supports these sources in each item’s icon field:
- Favicons: write
faviconand Dashy downloads the site’s real icon from its URL. - Homelab logos: the
hl-prefix followed by the service name (for examplehl-jellyfin), from the hugeselfh.st/iconscatalogue. - Font Awesome:
fas fa-nameorfab fa-name, enablingenableFontAwesome. - Material Design Icons:
mdi-name, enablingenableMaterialDesignIcons. - Emoji or URLs: paste an emoji or the link to an image directly.
Between themes, icons and widgets, two Dashy installs can look like different applications. That is its strength against more rigid panels like Heimdall: you start from a template and end up with a front page tailored to you.
Frequently asked questions
How is Dashy different from Homarr or Heimdall?
All three are self-hosted start pages, but with different philosophies. Heimdall is the simplest: a grid of shortcuts on the LinuxServer image. Homarr bets on a drag-and-drop visual editor and configuration stored in a database. Dashy sits in the middle: its configuration lives in a versionable conf.yml file, but it also offers a visual editor, and it beats both on status checking and the variety of widgets.
Does Dashy need a database?
No. Unlike other panels, Dashy requires no external database: all its state fits in the conf.yml file and the user-data folder. That makes backups vastly simpler, because you just save that folder, and it makes it ideal to version in Git. It is also the reason its resource footprint is modest for what it offers.
How do I back up my Dashy configuration?
Copy the user-data folder, which is where conf.yml and any local icons you have added live. Since it is plain text, you can keep it in a private Git repository, gaining a change history on top of the backup. If you edit from the visual interface, remember to save the changes to disk so they are written to conf.yml and do not stay only in the browser.
Conclusion
With a single docker-compose.yml and one conf.yml file, Dashy gives you a front page for your whole homelab on port 4000. You get cards arranged by sections, live status checking, widgets with real data and almost unlimited customisation of themes and icons.
Because it depends on no database, backing it up comes down to saving a plain-text folder. Start with the sample configuration, add your services one by one and, when you want to serve it with your own domain, place it behind a reverse proxy. If you prefer a fully visual editor, compare it first with Homarr.