HPA scale to zero in Kubernetes 1.37: try it on k3s
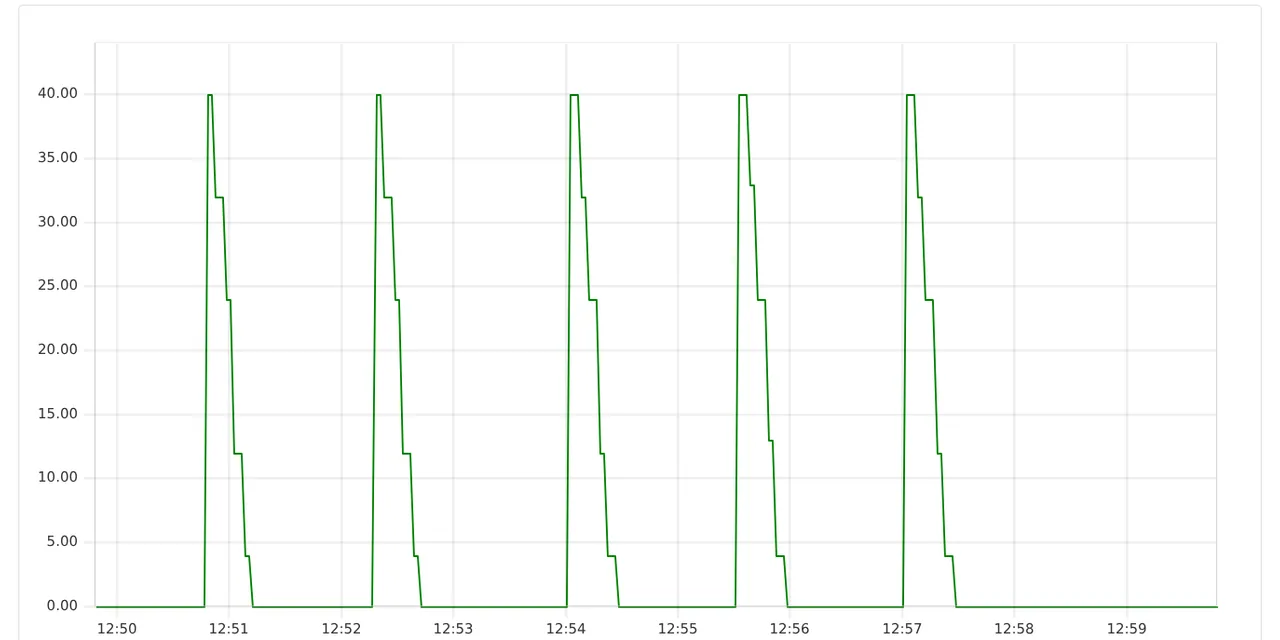
Table of contents
- Key takeaways
- What Kubernetes 1.37 changes for HPA scale to zero
- Why a CPU-based HPA cannot scale to zero
- What you need to try it on k3s
- Step 1: start k3s 1.37 in a container
- Step 2: the Redis queue and its Prometheus metric
- Step 3: serve the metric with prometheus-adapter
- Step 4: the HPA with minReplicas: 0
- How long the cycle from 0 to N and back to 0 takes
- Three traps I found while testing it
- Native HPA or KEDA: when to use each
- Frequently asked questions
- Can an HPA scale to zero with CPU and an external metric at the same time?
- What happens to HTTP requests that arrive while the deployment is at zero?
- Does it work on Kubernetes 1.36 or earlier?
- Conclusion
- Sources
Since Kubernetes 1.37, a HorizontalPodAutoscaler (HPA) can take a deployment down to zero pods and bring it back without enabling any feature gate. The condition is that it scales on an External or Object metric, such as the length of a queue; with CPU or memory the API rejects the object. In this guide I build it on k3s 1.37 inside Docker, with a Redis queue, Prometheus and prometheus-adapter, and time the full cycle from 0 to N and back to 0. There is also a Spanish version of this guide.
Key takeaways
- Kubernetes 1.37, released on 26 August 2026, moves HPA scale to zero to beta and enables it by default (feature gate
HPAScaleToZero). minReplicas: 0requires at least one External or Object metric; a CPU-only HPA returnsmust specify at least one Object or External metric.- k3s v1.37.0+k3s1 shipped on 15 September 2026 and sits on the
latestchannel; thestablechannel is still on v1.36.4+k3s1. - Over eight cycles with 40 jobs, the HPA requested the first pod after a median of 13.0 s (3.9 to 17.5 s, depending on when the metric arrives within the 5 and 15 s loops) and was back at 0 after 58.1 s, with a 30 s scale-down window.
- A deployment created with
replicas: 0never scales: the HPA reportsScalingDisableduntil you raise it to 1 by hand. - Only one server can answer
external.metrics.k8s.ioin a cluster, so prometheus-adapter and KEDA cannot both serve external metrics.
What Kubernetes 1.37 changes for HPA scale to zero
Kubernetes 1.37 promotes to beta a feature that had been alpha since version 1.16: an HPA with spec.minReplicas: 0. Until now you had to enable the HPAScaleToZero feature gate on the kube-apiserver and the kube-controller-manager, which a managed service does not always let you do. From 1.37 it is on.
The Kubernetes v1.37 announcement[1] limits the scope to object and external metrics, and names queue consumers, batch jobs and GPU workloads as targets. The enhancement proposal behind it, KEP-2021[2], was opened on 26 September 2020, so the feature took six years to reach beta.
The visible change in the HPA status is the ScaledToZero condition. While the HPA holds the deployment at zero it sets it to True; when it scales up again it becomes False with reason NotScaledToZero. That is how the controller tells a deployment it scaled down itself from one that somebody stopped by hand with replicas: 0.
Why a CPU-based HPA cannot scale to zero
A CPU-based HPA averages the usage of the pods that are running, and with zero pods there is no sample at all. The HPA documentation[3] puts it as those metrics "can only be measured on running Pods". If the HPA dropped to zero on CPU, it would have no data to scale back up.
The API blocks it when you create the object. This HPA asks for minReplicas: 0 with a single CPU metric:
apiVersion: autoscaling/v2
kind: HorizontalPodAutoscaler
metadata:
  name: worker-cpu
  namespace: cola
spec:
  scaleTargetRef: {apiVersion: apps/v1, kind: Deployment, name: worker}
  minReplicas: 0
  maxReplicas: 5
  metrics:
  - type: Resource
    resource:
      name: cpu
      target: {type: Utilization, averageUtilization: 70}
Applied on k3s 1.37, the kube-apiserver rejects it with this message:
The HorizontalPodAutoscaler "worker-cpu" is invalid: spec.metrics:
Forbidden: must specify at least one Object or External metric to
support scaling to zero replicas
The metric that decides the step from 0 to 1 has to live outside the pods. The length of a queue, pending requests on a load balancer or unread messages on a topic all work, which is why this guide builds a queue with its own metric.
What you need to try it on k3s
The whole test runs in Docker, without installing k3s on the system. I used an 18-core arm64 Linux VM (OrbStack on Apple silicon) shared with other jobs, and these parts, each the latest release on 27 September 2026:
- k3s v1.37.0+k3s1: the
rancher/k3s:v1.37.0-k3s1image is 84.9 MB and has an arm64 variant - Redis 8.10.2: the queue, a list called
trabajos("jobs") - redis_exporter v1.92.0: publishes the list length as a Prometheus metric
- Prometheus 3.15.0: scrapes that metric every 5 s
- prometheus-adapter v0.12.0: serves the metric on the
external.metrics.k8s.ioAPI, which is what the HPA queries
If you do not have a cluster yet, the guide to install k3s in your homelab covers a real machine. The k3s vs k0s vs Talos Linux comparison explains why k3s suits a lab. Note that k3s 1.37 is on the latest channel, not stable, according to the k3s release channels[4]. An install script run without INSTALL_K3S_CHANNEL=latest gives you 1.36.
Step 1: start k3s 1.37 in a container
A privileged container with the official image is enough for a full server node. I disable Traefik and the ServiceLB load balancer because the test exposes nothing to the outside:
docker network create hpa-net
docker run -d --name hpa-k3s --hostname hpa-k3s \
  --network hpa-net --privileged \
  --tmpfs /run --tmpfs /var/run \
  -v "$PWD/manifests:/manifests" \
  rancher/k3s:v1.37.0-k3s1 \
  server --disable traefik --disable servicelb
On my machine the container and network carried another prefix; here I call them hpa-k3s and hpa-net. The node reached Ready 5.8 s after docker run, with the load average at 1.6. Every kubectl command in this guide runs inside the container with docker exec hpa-k3s kubectl …, so you need no kubeconfig on your machine. Before going on, check that the feature gate is on:
$ docker exec hpa-k3s sh -c \
    'kubectl get --raw /metrics | grep HPAScaleToZero'
kubernetes_feature_enabled{name="HPAScaleToZero",stage="BETA"} 1
I hit one problem unrelated to Kubernetes. Docker Hub answered 429 Too Many Requests to both the k3s containerd and the host Docker, so I switched to copies on other registries: public.ecr.aws/docker/library/redis, quay.io/prometheus/prometheus and quay.io/oliver006/redis_exporter. The manifests below already use those names.
Step 2: the Redis queue and its Prometheus metric
The test workload is a job queue in a Redis list, and the metric that drives scaling is its length. The exporter runs in the same pod as Redis and watches a single key with --check-single-keys:
apiVersion: apps/v1
kind: Deployment
metadata:
  name: redis
  namespace: cola
spec:
  replicas: 1
  selector:
    matchLabels: {app: redis}
  template:
    metadata:
      labels: {app: redis}
    spec:
      containers:
      - name: redis
        image: public.ecr.aws/docker/library/redis:8.10.2-alpine
      - name: exporter
        image: quay.io/oliver006/redis_exporter:v1.92.0
        args: ["--check-single-keys=db0=trabajos"]
The full manifest adds the cola namespace and a Service with ports 6379 and 9121. One detail matters here: Redis deletes a list once it is empty, but redis_exporter keeps publishing redis_key_size{key="trabajos"} 0 for the missing key. The metric never disappears, so the HPA never loses its data point right when the queue is empty.
Prometheus runs as a Deployment with this configuration, mounted from a ConfigMap. prometheus-adapter later uses the namespace label to tie the series to the HPA’s namespace:
global:
  scrape_interval: 5s
scrape_configs:
- job_name: redis
  static_configs:
  - targets: ["redis.cola.svc:9121"]
    labels: {namespace: cola}
If you prefer a Prometheus outside the cluster, the guide to install Prometheus with Docker works as well; prometheus-adapter only needs to reach its URL.
Step 3: serve the metric with prometheus-adapter
The HPA does not talk to Prometheus: it asks the aggregated external.metrics.k8s.io API for the metric, and prometheus-adapter implements that API. This rule turns the Redis series into an external metric called trabajos_pendientes:
externalRules:
- seriesQuery: 'redis_key_size{key="trabajos"}'
  resources:
    overrides:
      namespace: {resource: namespace}
  name:
    as: trabajos_pendientes
  metricsQuery: sum(<<.Series>>{<<.LabelMatchers>>})
The adapter starts with --prometheus-url=http://prometheus.cola.svc:9090, --config pointing at that rule and --metrics-relist-interval=30s; the default is 10 minutes, too long for a test. It also needs a ServiceAccount with the standard permissions of an aggregated API server (system:auth-delegator and the extension-apiserver-authentication-reader role in kube-system). The piece that plugs it into the kube-apiserver is the APIService:
apiVersion: apiregistration.k8s.io/v1
kind: APIService
metadata:
  name: v1beta1.external.metrics.k8s.io
spec:
  group: external.metrics.k8s.io
  version: v1beta1
  service: {name: adapter, namespace: cola}
  insecureSkipTLSVerify: true
  groupPriorityMinimum: 100
  versionPriority: 100
insecureSkipTLSVerify is fine for a lab, because the adapter generates a self-signed certificate in --cert-dir; in production, set the caBundle. As soon as the adapter finished its first listing, the metric answered from the API:
$ kubectl get --raw \
  /apis/external.metrics.k8s.io/v1beta1/namespaces/cola/trabajos_pendientes
{"kind":"ExternalMetricValueList",
 "apiVersion":"external.metrics.k8s.io/v1beta1","metadata":{},
 "items":[{"metricName":"trabajos_pendientes","metricLabels":{},
 "timestamp":"2026-09-27T10:50:22Z","value":"0"}]}
I split the output into lines so it reads; the API returns it on one.
Step 4: the HPA with minReplicas: 0
The worker is a Deployment that pops an item off the list with BLPOP, spends 2 s "processing" it and repeats. The HPA targets it with the external metric and a target of 5 jobs per pod:
apiVersion: autoscaling/v2
kind: HorizontalPodAutoscaler
metadata:
  name: worker
  namespace: cola
spec:
  scaleTargetRef: {apiVersion: apps/v1, kind: Deployment, name: worker}
  minReplicas: 0
  maxReplicas: 5
  metrics:
  - type: External
    external:
      metric: {name: trabajos_pendientes}
      target: {type: AverageValue, averageValue: "5"}
  behavior:
    scaleDown:
      stabilizationWindowSeconds: 30
With AverageValue, the HPA divides the metric by the pods and asks for ceil(40 / 5) = 8 replicas for 40 jobs, which maxReplicas caps at 5. The 30 s scale-down window is for the demo, because the default is 300 s. In production, keep the default or raise it so pods do not start and stop with every burst.
With the queue empty, the HPA took the deployment from 1 to 0 pods 30.2 s after it was created. That is the median of three runs, 30.1 to 30.7 s, with the load average below 3. This is the resulting status:
Conditions:
  Type            Status  Reason              Message
  AbleToScale     True    SucceededRescale    the HPA controller was able
                                              to update the target scale to 0
  ScalingActive   True    ValidMetricFound    the HPA was able to
                                              successfully calculate a replica
                                              count from external metric
                                              trabajos_pendientes(nil)
  ScaledToZero    True    ScaledToZero        the HPA controller scaled the
                                              workload to zero
Events:
  Normal  SuccessfulRescale  New size: 0; reason: All metrics below target
How long the cycle from 0 to N and back to 0 takes
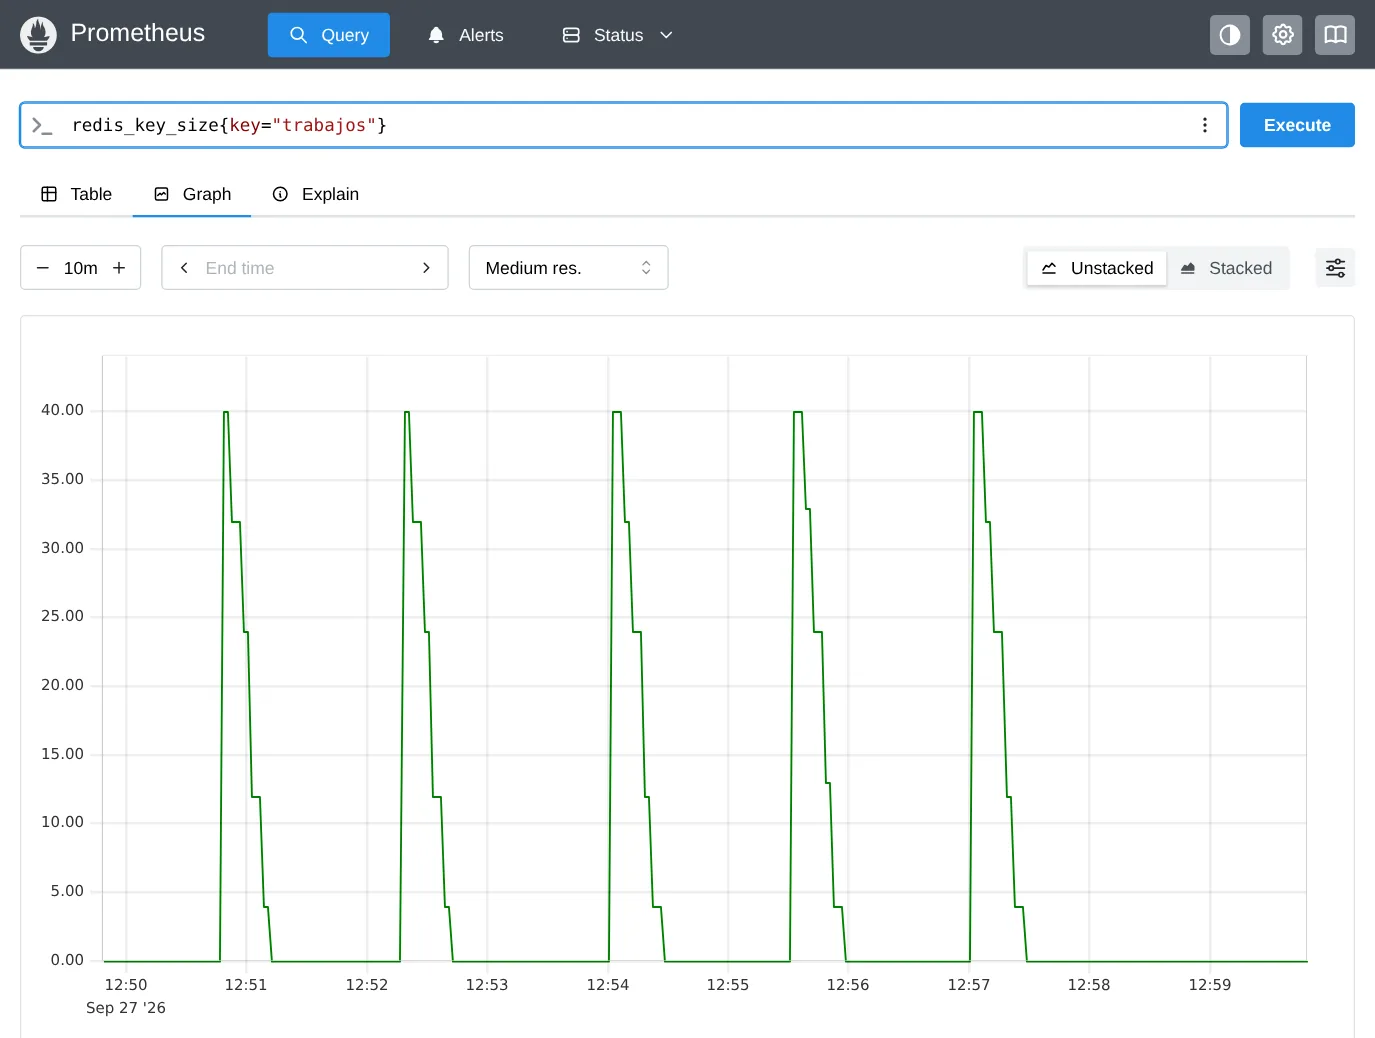
With 40 jobs and the deployment at zero, the HPA requested the first pod after a median of 13.0 s, with a range of 3.9 to 17.5 s. The deployment was back at zero after 58.1 s. That is eight cycles with the configuration above, measured from the RPUSH to each change in the Deployment, with a random 40 to 55 s pause between them:
| Cycle | Replicas requested | First pod ready | Queue empty | Back to 0 | Max replicas |
|---|---|---|---|---|---|
| 1 | 13.3 s | 14.4 s | 32.3 s | 58.5 s | 4 |
| 2 | 17.5 s | 18.2 s | 36.0 s | 62.2 s | 4 |
| 3 | 15.1 s | 16.3 s | 34.4 s | 59.9 s | 4 |
| 4 | 6.3 s | 7.5 s | 25.5 s | 51.3 s | 4 |
| 5 | 14.6 s | 15.8 s | 33.6 s | 59.9 s | 4 |
| 6 | 12.7 s | 13.3 s | 31.3 s | 57.6 s | 4 |
| 7 | 9.7 s | 10.9 s | 29.1 s | 54.8 s | 4 |
| 8 | 3.9 s | 5.0 s | 23.4 s | 49.0 s | 4 |
A script polled the Deployment every half second with kubectl, so each figure carries a 1 s margin. I only accepted cycles that started with the one-minute load average below 3 on the 18 cores, k3s and the lab included; they started between 1.07 and 2.99. The worker image was already cached, so pod start does not include the pull.
The scale-up delay depends on when the RPUSH arrives within two loops: Prometheus scrapes the metric every 5 s and the HPA controller queries it every 15 s. That puts the worst case at around 20 s before the first pod is requested, and my worst cycle stopped at 17.5 s. If your queue cannot tolerate that wait, do not scale it to zero.
A first batch of six cycles with a fixed pause always gave 4.4 to 4.9 s. Each cycle lasted almost an exact multiple of 15 s, so the RPUSH always arrived just before an evaluation. Do not read that figure as the typical latency.
Once up, the first pod was ready 0.6 to 1.2 s after it was requested. Four pods at 2 s per job emptied the queue in about 18 s.
Scaling down was the most stable part: the deployment reached zero 25.5 to 26.3 s after the queue emptied. The 30 s window counts from the last evaluation that still saw pending jobs, which comes a few seconds before the list is empty. With the default 300 s window, expect about five minutes between an empty queue and zero.
Three traps I found while testing it
The first trap is the hardest to spot: a deployment born with replicas: 0 never scales, even if its HPA has minReplicas: 0 and the queue is full. KEP-2021 already warns about it. I reproduced it with a second deployment created at zero and 77 jobs queued:
Metrics:                          ( current / target )
  "trabajos_pendientes" (target average value):  <unknown> / 5
Conditions:
  AbleToScale    True    SucceededGetScale  the HPA controller was able
                                            to get the target's current scale
  ScalingActive  False   ScalingDisabled    scaling is disabled since the
                                            replica count of the target is zero
The HPA cannot tell whether that zero came from itself or from a person, and when in doubt it leaves it alone, because replicas: 0 is still the way to pause an HPA. The fix is to start with replicas: 1 or raise it once by hand: after a kubectl scale --replicas=1, the HPA went to 5 pods at its next evaluation and set ScaledToZero False.
The second trap is in the first step: with 40 jobs the calculation asked for 5 pods, but the deployment went from 0 to 4. The default scale-up policy allows, every 15 s, the larger of two values: doubling the pods (100 %) or adding 4. From zero, 100 % is zero pods, so the 4-pod rule wins. If your workload needs more pods at once, raise the Pods value in behavior.scaleUp.policies.
The third one is cosmetic, but it misleads. In the evaluation that takes the deployment off zero, the HPA status records an average value of 9223372036854775807m, the maximum of a 64-bit integer, because it divides 40 jobs by zero pods. kubectl get hpa shows it as is in the TARGETS column until the next evaluation, which goes back to normal figures.
Native HPA or KEDA: when to use each
KEDA (Kubernetes Event-driven Autoscaling) has solved scale to zero for years with a different split of work. Its operator decides the step from 0 to 1 and creates an HPA that handles 1 to N. The KEDA documentation[5] calls those two phases activation and scaling.
I checked it with KEDA 2.21.0 on a second k3s 1.37 and the same queue: even though the cluster now accepts minReplicas: 0, the HPA that KEDA generates for a ScaledObject with minReplicaCount: 0 still has minReplicas: 1. When jobs arrived, the KEDAScaleTargetActivated event recorded the step from 0 to 1, and then the HPA went up to 4. By default KEDA polls the queue every 30 s (pollingInterval) and waits 300 s (cooldownPeriod) before going back to zero.
| Criterion | Native HPA in 1.37 | KEDA 2.21 |
|---|---|---|
| Who decides the step from 0 to 1 | The HPA controller | The KEDA operator |
| Metric source | Any external.metrics.k8s.io or custom.metrics.k8s.io adapter |
70+ built-in scalers |
| Extra parts in the cluster | One adapter (here, Prometheus and prometheus-adapter) | KEDA operator, metrics server and webhooks |
| Project status | Beta in Kubernetes, on by default | CNCF graduated project; 2.21.0 released 23 September 2026 |
| Activation threshold separate from the scaling one | No | Yes (activation prefix, such as activationListLength) |
Both options compete for the same API. KEDA’s operations guide is explicit: "you can only run one active metric server in a Kubernetes cluster serving external.metrics.k8s.io which has to be the KEDA metric server". If prometheus-adapter already serves external metrics, installing KEDA replaces it.
One more fact to weigh: the latest prometheus-adapter release, v0.12.0, dates from 17 May 2024. It works on 1.37, as this test shows, but it has gone more than two years without a new release. My recommendation: if you already run Prometheus and have one or two metrics to scale on, the native HPA with prometheus-adapter is enough and saves you an operator. If you scale on queues from different services or need an activation threshold, KEDA is still the pick.
Frequently asked questions
Can an HPA scale to zero with CPU and an external metric at the same time?
Yes. Validation only requires at least one External or Object metric among the HPA’s metrics. I tested an HPA with CPU plus the queue: it went to zero and, with 40 jobs, came back to 4 pods. While there are no pods, the HPA logs FailedGetResourceMetric warnings for CPU and decides on the external metric; with pods running, it applies the larger of the two results.
What happens to HTTP requests that arrive while the deployment is at zero?
They fail or wait on the client, because the HPA does not hold traffic. KEP-2021 leaves request buffering at the Service level out of scope. HTTP services that must scale to zero need something in front that holds the request, such as Knative or the KEDA HTTP add-on; the native HPA fits queues and asynchronous jobs.
Does it work on Kubernetes 1.36 or earlier?
Yes, by enabling the HPAScaleToZero feature gate on the kube-apiserver and the kube-controller-manager, since the feature has existed as alpha since 1.16. On k3s you do it with --kube-apiserver-arg and --kube-controller-manager-arg. On a managed service that does not let you touch feature gates, you have to wait for 1.37.
Conclusion
HPA scale to zero in Kubernetes 1.37 works without special flags, and on k3s v1.37.0+k3s1 I had it running with four parts: Redis, redis_exporter, Prometheus and prometheus-adapter. What it demands is a metric that lives outside the pods, a deployment that is not born with zero replicas and a scale-down window chosen for your workload. The next step is to swap the toy queue for yours and check with kubectl describe hpa that the ScaledToZero condition flips as it did in this test.
Sources: [1] Kubernetes v1.37: Garhwal[1], [2] KEP-2021: HPA supports scaling to/from zero pods for object/external metrics[2], [3] Kubernetes: Horizontal Pod Autoscaling[3], [4] k3s release channels[4], [5] k3s v1.37.0+k3s1[6], [6] prometheus-adapter[7], [7] KEDA 2.21.0[8], [8] KEDA: Scaling Deployments[5], [9] KEDA: Cluster[9], [10] KEDA[10], [11] KEDA: ScaledObject specification[11].