Host and Container Metrics with Node Exporter and cAdvisor
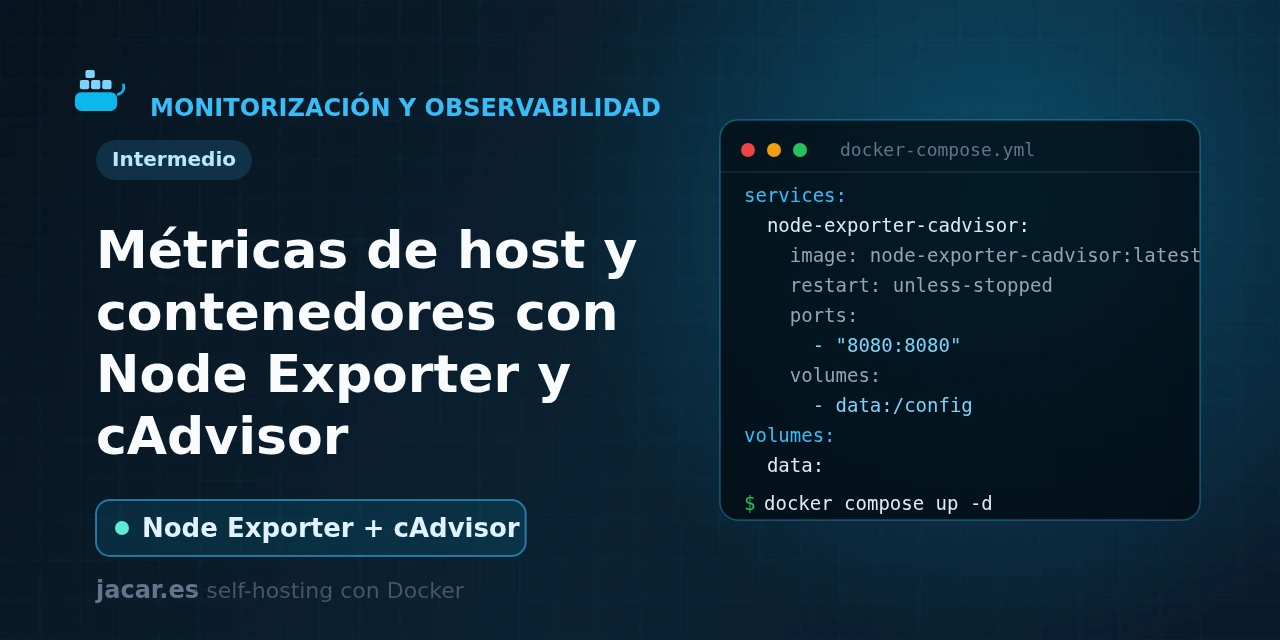
Table of contents
- Key takeaways
- What does Node Exporter measure and what does cAdvisor measure?
- What does the docker-compose.yml for both exporters look like?
- How do you connect them to Prometheus?
- What are the key CPU, RAM, disk and container metrics?
- How do you secure the exporters?
- Frequently asked questions
- Do I need both exporters or is one enough?
- Why does cAdvisor use so much CPU?
- Can I use cAdvisor without Prometheus?
- Conclusion
- Sources
Prometheus on its own has no idea how much CPU your server uses or how much RAM each container consumes: it needs exporters that translate the system’s state into metrics. The two essential ones are Node Exporter, for the host, and cAdvisor, for containers.
In this guide you bring both up with a single docker-compose.yml and connect them to Prometheus so it scrapes them automatically. You then review the key CPU, memory, disk and network metrics, and secure the exporters so they are not exposed. The same explanation is available in Spanish.
Key takeaways
- Node Exporter exposes host metrics (CPU, RAM, disk, network, load) on port 9100; its latest version is v1.12.1, released on 14 July 2026.
- cAdvisor (Container Advisor, by Google) exposes per-container metrics on port 8080; the latest stable version is v0.60.5.
- Node Exporter is light (about 20 MB of RAM at idle), while cAdvisor is heavier (around 150 MB) because it analyses every container in real time.
- Both connect to Prometheus as targets on the same Docker network, discovered by service name (
node-exporter:9100,cadvisor:8080). - The most-used Grafana dashboard for Node Exporter is number 1860 (Node Exporter Full), imported by its ID, which shows dozens of graphs with no manual setup.
What does Node Exporter measure and what does cAdvisor measure?
They are complementary, not interchangeable, and that is the most common confusion. Node Exporter measures the whole physical or virtual machine: CPU usage per core and per mode (user, system, disk wait). It also records total and available memory, and the space and activity of each filesystem.
And it measures network traffic per interface, load average and uptime. It knows nothing about containers; it sees the server as a whole. It is the official Prometheus project for Linux host metrics, and its collectors expose hundreds of distinct series.
cAdvisor measures each container separately: how much CPU and memory it consumes, its network traffic and disk usage, labelled by container name and image. Its own documentation puts it this way: "cAdvisor (Container Advisor) provides container users an understanding of the resource usage and performance characteristics of their running containers." In practice, Node Exporter answers "does the server have RAM left?" and cAdvisor answers "which container is eating that RAM?".
That is why they are deployed together: one gives the global picture and the other the breakdown. If you are coming from setting resource limits and logging in Docker, cAdvisor is the tool that confirms whether those limits are being respected.
What does the docker-compose.yml for both exporters look like?
Create a folder for the project and save this docker-compose.yml inside it. It brings both exporters up on a network called monitoring, the same one you will later connect Prometheus to. It does not publish their ports to the Internet: they are only reachable inside the Docker network.
services:
  node-exporter:
    image: prom/node-exporter:v1.12.1
    restart: unless-stopped
    command:
      - '--path.procfs=/host/proc'
      - '--path.sysfs=/host/sys'
      - '--path.rootfs=/rootfs'
      - '--collector.filesystem.mount-points-exclude=^/(sys|proc|dev|host|etc)($$|/)'
    volumes:
      - /proc:/host/proc:ro
      - /sys:/host/sys:ro
      - /:/rootfs:ro
    expose:
      - 9100
    networks:
      - monitoring

  cadvisor:
    image: gcr.io/cadvisor/cadvisor:v0.60.5
    restart: unless-stopped
    privileged: true
    devices:
      - /dev/kmsg
    volumes:
      - /:/rootfs:ro
      - /var/run:/var/run:ro
      - /sys:/sys:ro
      - /var/lib/docker/:/var/lib/docker:ro
      - /dev/disk/:/dev/disk:ro
    expose:
      - 8080
    networks:
      - monitoring

networks:
  monitoring:
    name: monitoring
It is worth understanding the mounts, because they are what lets a container see the state of the whole server. Node Exporter needs the host’s /proc and /sys (hence --path.procfs and --path.sysfs) and the filesystem root at /rootfs to compute real disk space. The --collector.filesystem.mount-points-exclude option keeps it from counting the container’s own internal mount points. The double $$ is not a typo: in Docker Compose it escapes a literal $ so the regular expression reaches the exporter intact.
cAdvisor asks for more access: it mounts the root, the Docker socket at /var/run, /sys and the /var/lib/docker directory, and it needs privileged: true together with the /dev/kmsg device to watch out-of-memory (OOM) events. Always pin a specific version like v0.60.5 instead of :latest, because a floating tag can change version during a simple restart and break the dashboard. With the file ready, start the stack and check that both exporters respond:
docker compose up -d
docker compose ps
curl -s localhost:9100/metrics | head    # only if you publish the port
How do you connect them to Prometheus?
The exporters only generate the metrics; the one that collects and stores them is Prometheus, which reads them at a set interval (the pull model). You add the two jobs to your prometheus.yml and join Prometheus to the monitoring network. Since they share a network, Prometheus reaches them by service name, with no need to publish any port:
scrape_configs:
  - job_name: node-exporter
    static_configs:
      - targets: ['node-exporter:9100']

  - job_name: cadvisor
    static_configs:
      - targets: ['cadvisor:8080']
Reload Prometheus and open its interface (Status, then Targets): both jobs should show as UP. If you see DOWN, it is almost always because Prometheus and the exporters are not on the same Docker network or because the service name does not match. The full process of installing and configuring the collector is in the guide on how to install Prometheus with Docker.
From there, the comfortable way to see the data is with dashboards. In Grafana you add Prometheus as a data source and import dashboard 1860 (Node Exporter Full) by its ID: in seconds you have host CPU, memory, disk and network in graphs. For containers there are equivalent dashboards based on cAdvisor’s metrics.
What are the key CPU, RAM, disk and container metrics?
You do not need to memorise the hundreds of available series; a handful covers 90% of daily monitoring. On the host side (Node Exporter):
node_cpu_seconds_total: CPU seconds per core and mode. The usage percentage is derived from theidlemode.node_memory_MemAvailable_bytes: the memory that is really available, more reliable than free memory.node_filesystem_avail_bytes: free space per filesystem; ideal for alerting before a disk fills up.node_load1andnode_network_receive_bytes_total: one-minute load average and inbound network traffic.
On the container side (cAdvisor), the series carry the name and image labels:
container_cpu_usage_seconds_total: accumulated CPU per container.container_memory_working_set_bytes: the real memory in use by each container, the one that counts towards the limit and the OOM.container_network_receive_bytes_totalandcontainer_fs_usage_bytes: network and disk per container.
With these two families you can build useful alerts from day one: "less than 10% disk left", "available RAM drops below 500 MB" or "a container exceeds 90% of its memory limit".
How do you secure the exporters?
Here is the most common security mistake in homelabs. Node Exporter’s metrics, and especially cAdvisor’s, reveal a lot about your infrastructure: container names, images, paths and traffic volume. Never publish ports 9100 and 8080 directly to the Internet. The docker-compose.yml above uses expose instead of ports for exactly this reason: the exporters are reachable only inside the Docker network, which is all Prometheus needs.
There is an extra risk specific to cAdvisor: by mounting the Docker socket and running with privileged: true, it has broad access to the host. Treat it as a sensitive component, keep it on the internal network and never expose it without authentication. If you need to reach the web interface of either one from outside, do it through a reverse proxy with a password or behind a VPN, never by opening the port on the firewall. The rule: the exporters talk to Prometheus over the internal network, and only Grafana (protected by its own login) faces outward.
Frequently asked questions
Do I need both exporters or is one enough?
It depends on what you want to watch. If you only care about server health (host CPU, RAM and disk), Node Exporter is enough. If you also want to know what each container consumes separately, you need cAdvisor. On a server running more than one service in Docker the usual choice is to deploy both, because they answer different questions: one measures the machine and the other each container.
Why does cAdvisor use so much CPU?
Because it walks and analyses every running container in real time, and that work grows with the number of containers. It is a known cost of the project. You can reduce it by disabling collectors you do not use (for example, with --disable_metrics=disk,tcp,udp). You can also raise the scrape interval in Prometheus from 15 to 30 seconds, which cuts the number of scrapes in half.
Can I use cAdvisor without Prometheus?
Yes. cAdvisor ships its own web interface on port 8080, where you see basic live usage graphs per container. It is handy for a quick check, but it keeps no history: as soon as you close the page, the data is gone. To keep metrics over time, create alerts and build dashboards, you need Prometheus to collect and store them.
Conclusion
With a single docker-compose.yml you have the two exporters any monitoring stack needs: Node Exporter for the host and cAdvisor for the containers, both on the internal network and ready for Prometheus to scrape. The next step is to connect them to Prometheus and visualise the data in Grafana by importing dashboard 1860. From there, stop guessing why your server feels slow: you will see it in a graph, with the culprit container named and shamed.
Sources
Source code
Access all the source code for this post on GitHub.
View on GitHub