How to View Container Logs with Dozzle
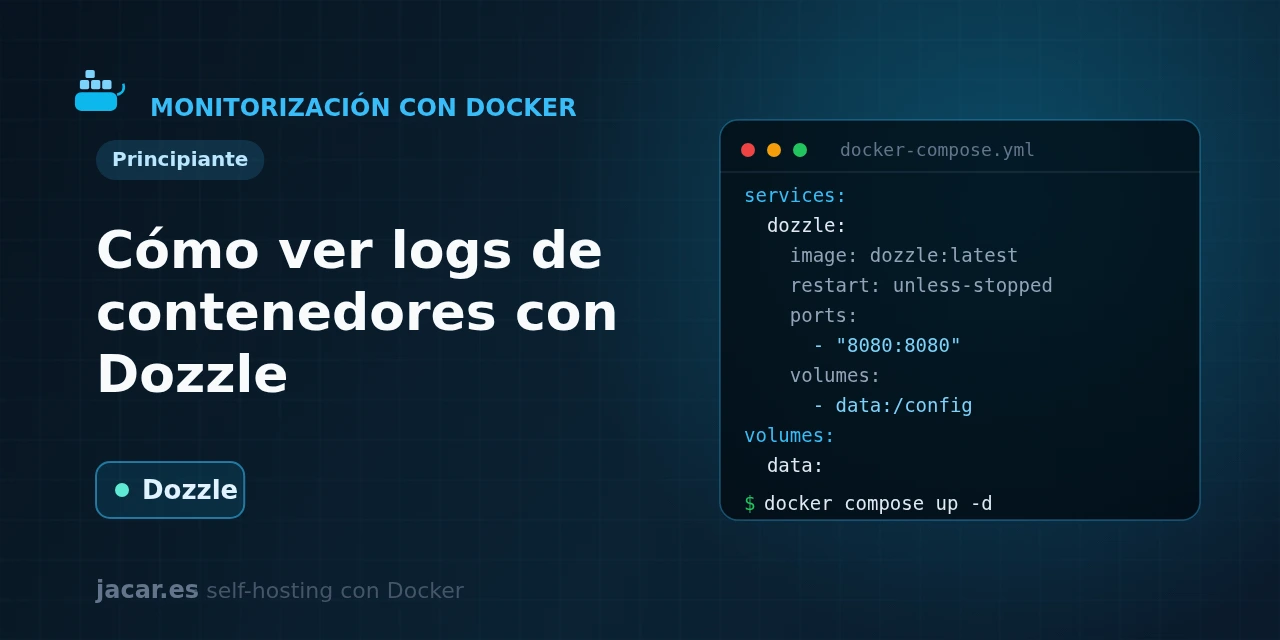
Table of contents
- Key takeaways
- What is Dozzle and what is it for?
- What does the docker-compose.yml for Dozzle look like?
- How do you view the logs in real time from the browser?
- How do you add authentication and monitor multiple hosts?
- Dozzle or Loki: when should you use each?
- Frequently asked questions
- Is it safe to mount the Docker socket in Dozzle?
- Does Dozzle keep a log history?
- How many resources does Dozzle use?
- Conclusion
- Sources
Dozzle turns the logs of all your containers into a single browser tab, updated live, without installing anything inside them. In this guide you bring it up with a single docker-compose.yml file, watch the logs in real time from http://127.0.0.1:8080, add an authentication layer and learn to monitor remote servers with its agent mode. By the end you will know when Dozzle is enough and when you need something heavier like Loki. The same explanation is available in Spanish.
Key takeaways
- Dozzle is a real-time log viewer for containers, written in Go and shipped as a tiny image,
amir20/dozzle, with more than 13,500 stars on GitHub. - It stores nothing: it reads the logs straight from the Docker socket and streams them to your browser, so its memory footprint is just a few megabytes.
- The web UI listens on port 8080, and for multiple servers there is an agent mode listening on port 7007 over TLS.
- Always pin a specific version such as
amir20/dozzle:v10.6.10; using the:latesttag exposes you to behaviour changes without warning. - It requires Docker Engine 19.03 or newer (API 1.40+) and supports file-based authentication (
simple) or proxy-delegated authentication (forward-proxy).
What is Dozzle and what is it for?
Dozzle is an open-source application that shows, in a clean web UI, the logs of your Docker containers in real time. Instead of chaining docker logs -f commands, one terminal window per container, you open a browser tab and watch the log stream of any container, with search, level filters and error highlighting. It is written in Go and shipped as a single binary inside a light image, which is why it uses so little memory.
The central idea to internalise is that Dozzle does not store the logs. It mounts no database and no index: it connects to the Docker socket (/var/run/docker.sock), asks the engine for each container’s records and forwards them to your browser as they arrive. When you close the tab, nothing is left behind.
That makes it ideal for live, ad-hoc inspection. It is no good for searching logs from three weeks ago: that is what Grafana Loki is for, since it does ingest and store the records.
Dozzle detects containers automatically: new ones appear in the list without a reload and stopped ones disappear. That is why it fits so well in a homelab, as a visual complement to a management panel like Portainer, where Dozzle handles the logs while the other manages the container life cycle.
What does the docker-compose.yml for Dozzle look like?
Dozzle needs a single thing to work: read access to the Docker socket. Everything else is fine-tuning. Here is a complete docker-compose.yml, with the version pinned, the socket mounted read-only, a named volume to persist settings and the port published only on the machine itself:
services:
  dozzle:
    image: amir20/dozzle:v10.6.10
    container_name: dozzle
    restart: unless-stopped
    volumes:
      - /var/run/docker.sock:/var/run/docker.sock:ro
      - dozzle_data:/data
    ports:
      - "127.0.0.1:8080:8080"
    environment:
      DOZZLE_LEVEL: info
      DOZZLE_ENABLE_ACTIONS: "false"
    healthcheck:
      test: ["CMD", "/dozzle", "healthcheck"]
      interval: 30s
      timeout: 5s
      retries: 3

volumes:
  dozzle_data:
A few details are worth pausing on. The socket is mounted as :ro (read-only), the bare minimum: Dozzle only needs to read, not to control containers, so leaving DOZZLE_ENABLE_ACTIONS at false reduces the risk surface. The named volume dozzle_data keeps settings such as notification profiles. The guide on resource limits and logging in Docker explains the difference between a volume and a bind mount.
And by publishing the port as 127.0.0.1:8080:8080 you keep it reachable only from the server itself, because Dozzle without authentication should never face the Internet.
Start the stack and check the status:
docker compose up -d
docker compose ps
docker compose logs -f dozzle
Open http://127.0.0.1:8080 and you will see the Dozzle UI with the container list in the sidebar.
How do you view the logs in real time from the browser?
When you enter, the left column lists every container the Docker engine knows about, with a colour indicator for its state. Click any of them and its log stream appears on the right, advancing live as the container writes new lines. You can pin two or more containers at once to watch them in parallel, which is handy when you debug an application and its database at the same time.
The features used most day to day are:
- Live search: filter the stream by text as the lines arrive, without stopping the stream.
- Level filter: highlight and isolate
error,warnorinfomessages, with automatic level detection in common formats. - Download: export a container’s available history to a text file to analyse it at leisure.
- Shareable links: each view has its own URL, so you can send a colleague the direct link to a specific container’s logs.
Remember that Dozzle shows whatever the Docker log driver keeps for each container. If you have capped the log size with rotation (for example, max-size: 10m), Dozzle will only see that window; the detail of how to configure rotation is in resource limits and logging in Docker.
How do you add authentication and monitor multiple hosts?
Dozzle ships with two authentication modes. The simplest is the simple provider, based on a users.yml file with the credentials and bcrypt-hashed passwords. The container itself generates that file for you:
docker run -it --rm amir20/dozzle:v10.6.10 generate admin
  --password "a-long-password"
  --email you@mail.com --name "Admin" > users.yml
Then you mount that users.yml at /data/users.yml and enable the provider with an environment variable:
    environment:
      DOZZLE_AUTH_PROVIDER: simple
    volumes:
      - ./users.yml:/data/users.yml:ro
The second mode is forward-proxy, which delegates authentication to an external service such as Authelia, Cloudflare Access or Pocket ID; Dozzle reads the identity from the Remote-User and Remote-Email headers the proxy injects. It is the natural choice if you already publish your services with single sign-on behind a reverse proxy like Traefik. That proxy routes incoming HTTP traffic to each container based on its domain.
To watch remote servers from one interface, Dozzle uses an agent mode. On each remote machine you start an agent that exposes its Docker over a TLS connection on port 7007:
services:
  dozzle-agent:
    image: amir20/dozzle:v10.6.10
    command: agent
    restart: unless-stopped
    volumes:
      - /var/run/docker.sock:/var/run/docker.sock:ro
    ports:
      - "7007:7007"
And on the central instance you tell it where those agents are with DOZZLE_REMOTE_AGENT, separating each address with a comma: DOZZLE_REMOTE_AGENT: server-1:7007,server-2:7007. That way you gather the logs of your whole fleet into a single tab, without opening each machine’s socket to the network.
Dozzle or Loki: when should you use each?
They do not compete, they complement each other. Dozzle is a live viewer, with no storage; Loki is an aggregation system that ingests, indexes by labels and keeps the logs so you can query them later with LogQL. The choice depends on the problem in front of you:
| Criterion | Dozzle | Grafana Loki |
|---|---|---|
| Purpose | Watch logs live | Store and query history |
| Storage | None (ephemeral) | Persistent, with retention |
| Historical query | No | Yes (LogQL) |
| Resources | A few MB of RAM | Hundreds of MB and disk |
| Setup | One container | Several (Loki, Promtail, Grafana) |
In practice a homelab can run both: Dozzle for the quick "what is happening right now?" glance and Loki for "what happened last night at three?". If you are only going to install one log tool and you want simplicity, start with Dozzle; when you need retention and complex searches, add Loki alongside it.
Frequently asked questions
Is it safe to mount the Docker socket in Dozzle?
Mounting /var/run/docker.sock grants access to the Docker engine, so treat it with care. Mitigate the risk by mounting it read-only (:ro), leaving DOZZLE_ENABLE_ACTIONS at false so Dozzle cannot stop or restart containers, and not exposing port 8080 to the Internet without authentication. For multiple hosts, agent mode is safer than opening the socket over the network, because it encrypts the connection with TLS.
Does Dozzle keep a log history?
No. Dozzle stores nothing: it streams live whatever the Docker log driver holds for each container. If you delete the container or Docker rotates its log file, that information disappears from Dozzle. To keep records for weeks or months, you need an aggregator with storage such as Grafana Loki; Dozzle is the live window, not the archive.
How many resources does Dozzle use?
Very few. Being written in Go and keeping no database, its idle consumption is measured in a few megabytes of RAM, a hundred times less than a Prometheus or Loki stack. It is one of the lightest services you can keep running permanently on a home server, even on a Raspberry Pi.
Conclusion
With a single docker-compose.yml and read access to the Docker socket, Dozzle gives you a live window into the logs of all your containers on port 8080, with search, level filters and download. Add the simple provider to protect it, agent mode on port 7007 to gather your remote servers, and you have an instant-diagnosis tool. When you need to keep and query the history, combine it with Grafana Loki and protect everything behind a reverse proxy. Dozzle is the quick glance; the rest of your observability stack is built around it.
Sources: [1] Official Dozzle documentation[1], [2] Dozzle repository on GitHub[2], [3] Official amir20/dozzle image on Docker Hub[3], [4] Docker Docs: logging drivers[4].