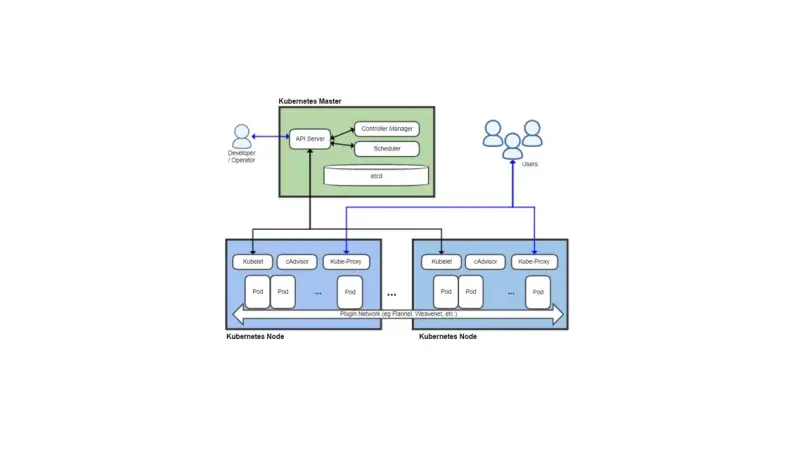
Kubernetes 1.35 GA consolidates three releases of work: native sidecars with full lifecycle management, generalised DRA for FPGAs and NPUs, and a scheduler that cuts resource waste by 15-25% in heterogeneous clusters. An operations-side balance sheet: what to enable now, what to watch before migrating, and what path to follow from 1.30.
After fourteen months testing AI-integrated DevOps tools across several teams, the stack that stays is small: Claude Code, Cursor, and Aider for code; PagerDuty AIOps, Datadog Bits AI, and Grafana Assistant for alert triage; and OpenTofu with OPA for infrastructure generation bounded by policy rules.
AI agents fail in production, and what matters is how you respond in the first twenty minutes. This runbook covers severity classification, isolating before investigating, purging contaminated memory, communicating without inventing facts, and turning every incident into a regression test before closing it as done.
Among the AI features in SRE dashboards, alert correlation is the one with demonstrated value: it groups dependent alerts from a single incident, cutting time to acknowledge and fatigue during a crisis. Automatic incident summaries help too. The real problem was never a shortage of information, it was separating signal from noise and correlating scattered symptoms.
Seven years on, the Site Reliability Workbook still earns its place in small teams through a handful of patterns: SLOs set slightly below what you already achieve, so the error budget is real and negotiable; a 28 to 30 day rolling window; and blameless postmortems that drop punishment while keeping accountability.
Kubernetes 1.32 Penelope shipped in December and has been running in clusters for several months. It is a good time to look at which changes have aged well, which created extra work, and what lessons to carry into the jump to 1.33.
Kubernetes 1.33 (Octarine) lands April 23. In-place pod resize moves to beta and ships on by default, sidecar containers finally reach GA, and several endpoint and security deprecations arrive that operators should review before upgrading from 1.32.
Chaos engineering is the practice of injecting real-world failures into production in a controlled way to verify that the system responds as expected. It requires prior hypotheses, a minimal blast radius, and mature observability. Open-source tools like Litmus and Chaos Mesh make adoption accessible without commercial spend; the ROI comes as avoided incidents and better-prepared teams.
SLOs and error budgets only work when the budget drives real decisions. A feature freeze that triggers on exhaustion, deploy velocity that adjusts to consumption. With two or three well-chosen SLIs, a clear freeze policy, and simple tools like Prometheus with Sloth, a team can sustainably balance velocity and reliability in production.
Blameless post-mortems are easy to proclaim but hard to execute well. Without genuine blame-free culture, a factual timeline, honest contributor analysis, and action items with a clear owner and deadline, the exercise degenerates into empty ritual that does nothing to prevent the same incidents from recurring.
Google's SRE book (2016) is canonical reading, but it is written for thousands of engineers and in-house datacenters: applying it literally on a small team creates friction. Five principles do travel (SLOs, error budgets, blameless postmortems, toil management, humane on-call); what does not scale is Google's infrastructure and dedicated roles.
The NIS2 Directive expands European cybersecurity from 7 to 18 sectors, mandates 10 minimum technical measures and 24-hour incident notification, and imposes fines of up to 10 million euros or 2% of global turnover, with personal liability for management bodies that fail to comply.
To write Prometheus alerts that won't get ignored, alert on customer-observable symptoms (latency, error rate, saturation) instead of internal causes like CPU or memory, define SLOs with multi-window burn rate to scale severity, add a watchdog alert that confirms the system is still alive, and review the signal-to-noise ratio every quarter.
Pixie uses eBPF to automatically instrument Kubernetes clusters without modifying application code. A per-node agent captures HTTP, gRPC, SQL, and Redis traffic at the kernel level, exposing service maps, CPU profiles, and SQL traces within minutes. It complements Prometheus for reactive diagnosis with no sidecars or redeploys.
5 min306
We use first- and third-party cookies to analyze site traffic. You can accept them, reject them, or configure your choice.
Learn more about cookies
Cookie preferences
NecessaryEssential for the site to work. Always on.
AnalyticsHelp us understand how the site is used (Google Analytics).