How to Install Netdata with Docker
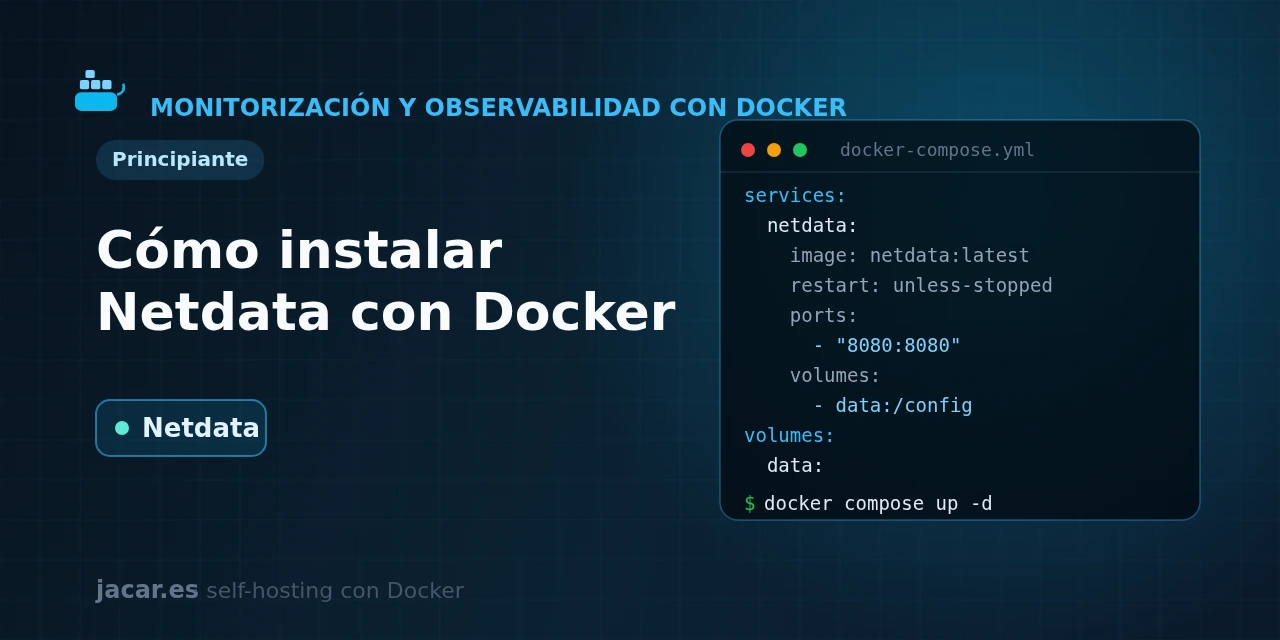
Table of contents
- Key takeaways
- What is Netdata and what is it for?
- What does the docker-compose.yml for Netdata look like?
- How do per-second metrics and auto-detection work?
- How do you configure alerts and notifications?
- Netdata or Prometheus plus Grafana?
- Frequently asked questions
- Why should I not use the Netdata latest tag?
- How many resources does Netdata use?
- Does Netdata keep the history if I delete the container?
- Conclusion
- Sources
Netdata is the fastest way to see, in real time and per second, what is happening to your server and to every container. With Docker you have it running without writing a single line of configuration.
In this guide you bring up Netdata with a single docker-compose.yml file and mount the host system paths it needs to see everything. You learn why it collects metrics per second and auto-detects your services. You configure alerts and notifications, and decide when Netdata suits you and when the Prometheus plus Grafana stack does. The same explanation is available in Spanish.
Key takeaways
- Netdata is an open-source real-time monitoring system (GPLv3+ licence), created by Costa Tsaousis and released in March 2016; today it is one of the most installed self-hosted observability tools.
- The most recent stable version is Netdata 2.10.4, released in July 2026; its official
netdata/netdataimage is based on Debian 13. - The web dashboard and the API listen on port 19999, and they need no initial configuration: Netdata detects hundreds of services and shows their charts right after it starts.
- It collects metrics at a one-second granularity, with no sampling or averaging, and stores them in its own
dbengine, which uses up to five tiers of resolution to keep the history while using very little disk. - Beware of the
:latesttag: in Netdata it points to the nightly builds. For a server usenetdata/netdata:stableor pin a specific version such asnetdata/netdata:v2.10.4.
What is Netdata and what is it for?
Netdata is a monitoring agent that you install on each machine. With no prior configuration, it starts collecting thousands of metrics from the operating system (CPU, memory, disk, network), from Docker containers and from the applications it finds (databases, web servers, queues). It shows all of that in its own web dashboard, with charts that update live at a one-second resolution.
It was born out of the frustration of its creator, Costa Tsaousis, who in 2013 could not diagnose why certain transactions were failing silently. The tools of the day gave few metrics at low resolution. Netdata’s answer is the opposite: collect almost everything, per second, and show it instantly. As its official documentation sums it up, Netdata collects metrics "per second, with no sampling, averaging or estimation", with a collection-to-visualisation latency below one millisecond.
The classic Prometheus and Grafana stack has to be assembled and configured piece by piece. Netdata’s pitch is immediacy: one container, zero configuration and a full dashboard from the first second. In exchange, each node stores its own data by default, a different model from a central store that we will look at below.
What does the docker-compose.yml for Netdata look like?
For Netdata to really see the host system (processes, disks, temperature, containers) the container needs to share the host’s process space and network, and to mount the host’s system paths read-only. This is the officially recommended configuration, with named volumes so the configuration, the data and the cache survive restarts:
services:
  netdata:
    image: netdata/netdata:v2.10.4
    container_name: netdata
    hostname: my-server
    pid: host
    network_mode: host
    restart: unless-stopped
    cap_add:
      - SYS_PTRACE
      - SYS_ADMIN
    security_opt:
      - apparmor:unconfined
    volumes:
      - netdataconfig:/etc/netdata
      - netdatalib:/var/lib/netdata
      - netdatacache:/var/cache/netdata
      - /:/host/root:ro,rslave
      - /etc/passwd:/host/etc/passwd:ro
      - /etc/group:/host/etc/group:ro
      - /etc/os-release:/host/etc/os-release:ro
      - /etc/localtime:/etc/localtime:ro
      - /proc:/host/proc:ro
      - /sys:/host/sys:ro
      - /var/log:/host/var/log:ro
      - /var/run/docker.sock:/var/run/docker.sock:ro

volumes:
  netdataconfig:
  netdatalib:
  netdatacache:
Each block is worth understanding. The pid: host option lets Netdata see all of the host’s processes and not just the container’s. With network_mode: host it reaches the real network interfaces and publishes the dashboard on the machine’s port 19999. The SYS_PTRACE and SYS_ADMIN capabilities, together with apparmor:unconfined, let the agent read process and kernel information that would otherwise be blocked.
The three named volumes (netdataconfig, netdatalib, netdatacache) keep your configuration and the metrics history. If you want to review the difference between a named volume and a bind mount, we explain it in the guide on Docker volumes and bind mounts. The /var/run/docker.sock mount in read-only mode is what lets it discover and measure each container by name.
Start the stack and follow the boot in the logs:
docker compose up -d
docker compose ps
docker compose logs -f netdata
Open http://localhost:19999 in the browser and you will see the dashboard with every section already populated. The official image includes its own internal HEALTHCHECK (it queries /api/v1/info), so docker compose ps will report the container as healthy as soon as the agent is ready, without you defining anything.
A security note: with network_mode: host, port 19999 is exposed on all of the machine’s interfaces. Netdata ships with no login in its agent edition, so do not leave it reachable on the Internet as is. Protect it with the firewall, or publish it with authentication and HTTPS behind a reverse proxy such as Traefik.
How do per-second metrics and auto-detection work?
Netdata’s hallmark is resolution. Other systems collect data every 15, 30 or 60 seconds. Netdata does it every second and without averaging, so a CPU spike lasting three seconds shows up as three real points and is not lost in an average. That detail makes the difference when you are chasing an intermittent problem.
To keep that much resolution without filling the disk, Netdata uses its dbengine database engine, organised in tiers. Tier 0 stores the per-second data, tier 1 aggregates it per minute and tier 2 per hour, up to five tiers. Recent data keeps the maximum detail and older data is compressed to lower resolution, taking around half a byte per sample at high resolution. You can decide how much history to keep by tuning the size of each tier in the configuration.
Auto-detection is the other half of the trick. On startup, Netdata inspects the system and turns on the relevant collectors by itself.
If it detects containers through the Docker socket, it monitors them one by one. If it finds a PostgreSQL (a widely used relational database), an Nginx or a Redis (an in-memory data store for caching and queues), it reads their statistics without you configuring anything. It is the same kind of system and container metrics that in the Prometheus stack you would have to expose by hand with a Node Exporter and a cAdvisor, here solved in one go.
How do you configure alerts and notifications?
Netdata does not just draw charts: it ships hundreds of ready-made alerts on the most common metrics (disk usage, available memory, restarting containers, network saturation). When one of those conditions is met, the agent raises an alarm that you will see flagged on the dashboard, in the alerts section, without having touched anything.
For those alarms to leave the machine and reach you, you configure the health_alarm_notify.conf file. The cleanest way to edit it with this installation is to use the edit-config script inside the container, which copies the template into the configuration volume:
docker exec -it netdata /usr/sbin/netdata-updater.sh --help
docker exec -it netdata edit-config health_alarm_notify.conf
In that file you enable the methods you want: email, Telegram, Slack, Discord or your own push-notification server. If you would rather get the alerts on your phone without depending on third parties, it fits nicely with ntfy, a self-hosted push-notification server. Netdata can send to it through a web call. You can also create or tune your own alerts in the health.d folder, defining the threshold and severity of each one.
Netdata or Prometheus plus Grafana?
They do not compete in exactly the same league, and choosing well depends on your scale. Netdata is an all-in-one: it collects, stores, alerts and visualises in a single container, per second and with no configuration. It is ideal for one or a few servers where you want full visibility now, with the least effort.
Its weak point is that, by default, each agent stores its own data locally. Aggregating the history of your whole fleet in one place is not its strength without turning to Netdata Cloud.
The Prometheus with Grafana stack is the opposite: more pieces to assemble and configure, a pull model with a central time-series store and dashboards you build yourself. In exchange it gives you a single repository for dozens of servers, a powerful query language (PromQL) and a huge ecosystem of exporters and dashboards.
For a homelab that is starting out, Netdata gives you results in a minute; for a large fleet with long-term retention and custom queries, the Prometheus plus Grafana stack scales better. Nothing stops you from using both: in fact, Netdata can expose its metrics in Prometheus format so Prometheus can scrape them. If you want something even lighter, compare it too with Glances as a system monitor.
Frequently asked questions
Why should I not use the Netdata latest tag?
Because in Netdata the :latest tag points to the nightly builds, meant for trying out new features, not for production. If you write netdata/netdata:latest you will get recent builds that can change from one day to the next. For a stable server use the netdata/netdata:stable tag, or better pin a specific version such as netdata/netdata:v2.10.4 and decide when to upgrade by recreating the container with a new image.
How many resources does Netdata use?
Fewer than its number of charts suggests, because it is written in C and heavily optimised. On a home server the agent sits at a few hundred MB of RAM and low CPU usage. How far it climbs depends on how many metrics you collect and how much history you keep in the dbengine. If you are short on memory, you can reduce the number of storage tiers or the retention of each one in the configuration, and lower the footprint that way.
Does Netdata keep the history if I delete the container?
Yes, as long as you use the named volumes from this guide. The container is ephemeral, but netdatalib and netdatacache keep the metrics database and survive docker compose down; when you recreate the service, the history is mounted again. You would only lose it with docker compose down -v, which also removes volumes. Even so, by default Netdata is meant for each node’s history: for centralised retention across your whole fleet you use Netdata Cloud or export the metrics to a store such as Prometheus.
Conclusion
With a single docker-compose.yml and the host mounts you have a persistent Netdata that monitors your server and all its containers per second. It brings auto-detection, hundreds of ready-made alerts and a full dashboard on port 19999, all with almost no configuration.
It is the fastest route to observability in a homelab: start it, protect it behind a reverse proxy and connect it to ntfy for notifications. If your infrastructure grows, complement or replace it with the Prometheus plus Grafana stack. From here, every new service appears on your dashboard by itself.