How to Monitor Your Server with Glances in Docker
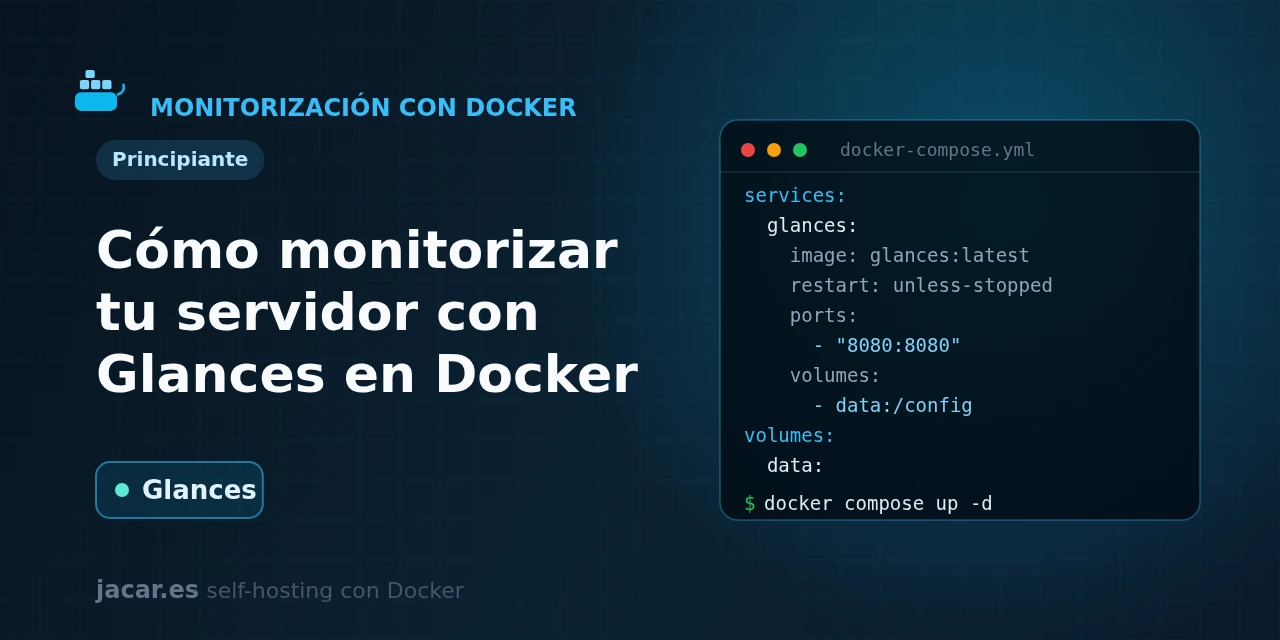
Table of contents
- Key takeaways
- What is Glances and what does it monitor?
- What does the docker-compose.yml for Glances look like?
- What system and container metrics does it show?
- How do you use client/server mode and the REST API?
- Glances or Netdata: which one to choose?
- Frequently asked questions
- Why does Glances not see my containers or the host processes?
- Should I use the Glances latest tag?
- How many resources does Glances use?
- Conclusion
- Sources
Glances gives you a complete picture of your server at a glance, and with Docker you have it watching CPU, memory, disk, network and containers in a couple of minutes. In this guide you bring up Glances in web server mode with a single docker-compose.yml file and see which system and container metrics it shows. You expose its REST API to automate things and decide when it beats Netdata. The same explanation is available in Spanish.
Key takeaways
- Glances is a cross-platform system monitor written in Python by Nicolas Hennion (nicolargo) back in 2011; it relies on the
psutillibrary and works as atopandhtopalternative with a web UI and an API. - The latest stable version is Glances 4.5.5, released on 13 June 2026; pin that tag instead of
:latestso upgrades never surprise you. - In web server mode the UI lives on port 61208; client/server mode (XML-RPC) uses 61209, and both are published together.
- Glances exposes a REST API at
/api/4(for examplehttp://localhost:61208/api/4/cpu), which lets you feed dashboards such as Homepage or alerting scripts. - To see containers you need to mount
/var/run/docker.sockread-only; for the host’s real processes and memory, start withpid: host.
What is Glances and what does it monitor?
Glances is a real-time system monitoring tool. On a single screen it gathers what you would otherwise ask of a different command per metric.
There you see: per-core CPU usage, memory and swap, system load, disk input and output, network traffic, temperature sensors and the most demanding processes. If you give it socket access, it adds the state of your Docker containers. It is written in Python and collects data through the psutil library, the same one other observability tools in the ecosystem use.
Its charm is the density of information with no configuration. You start the container and you already have a full picture, with colours that shift from green to red according to each metric’s threshold. You can use it in three ways: in the console (like an htop on steroids), in web server mode to view it from the browser and in client/server mode to query a remote machine.
As its documentation puts it, Glances is "a top/htop alternative" meant to watch a whole system in a single glance. For the context of what resource limits and logs are, which you will see reflected here, there is the guide on resource limits and logging in Docker.
What does the docker-compose.yml for Glances look like?
The official image is nicolargo/glances on Docker Hub, with tag variants: the -full suffix adds the optional dependencies (sensors, GPU, exporters), so for a home server the full, version-pinned tag is the right choice. This docker-compose.yml starts Glances in web server mode, mounts the Docker socket read-only to see containers and uses pid: host so that process metrics belong to the host and not the container:
services:
  glances:
    image: nicolargo/glances:4.5.5-full
    restart: unless-stopped
    pid: host
    environment:
      GLANCES_OPT: "-w"
    ports:
      - "61208:61208"
    volumes:
      - /var/run/docker.sock:/var/run/docker.sock:ro
      - /etc/os-release:/etc/os-release:ro
    healthcheck:
      test: ["CMD-SHELL", "python3 -c \"import urllib.request; urllib.request.urlopen('http://localhost:61208/')\" || exit 1"]
      interval: 30s
      timeout: 10s
      retries: 3
Three details are worth pausing on. The GLANCES_OPT: "-w" variable is what enables web server mode; without it the container starts in the console and serves no UI. The /var/run/docker.sock:...:ro mount gives Glances read-only access to the Docker API to list containers and their usage, without letting it control them. And pid: host shares the host’s process namespace, so the processes tab shows what actually runs on the machine.
The healthcheck uses the image’s own Python to check that the web UI responds, avoiding any dependency on curl or wget being installed.
With the file in place, start the stack and check the status:
docker compose up -d
docker compose ps
docker compose logs -f glances
Open http://localhost:61208 in the browser and you will see the Glances dashboard updating on its own. The default refresh is 1 second; you can change it by appending the interval to the URL, for example http://localhost:61208/5 to refresh every 5 seconds and ease the load.
What system and container metrics does it show?
The dashboard is organised in blocks. At the top you get the CPU, memory, swap and load summary. On the left, network, disk input and output, filesystems and sensors; in the central body, the process list sorted by usage, just like in htop. Each value changes colour when it crosses a threshold (by default, careful above 70% and critical above 90%), so a red figure stands out without having to read the numbers.
Because you gave it access to the Docker socket, Glances adds a containers section with each one’s name, state, CPU and memory usage, and network traffic. It is a quick way to see which container is eating the machine without opening Portainer or typing docker stats. If you also want to export these figures to a time-series system and chart them in historical dashboards, Glances can push to Prometheus, InfluxDB or Graphite. For that more complete route there is the guide on how to install Prometheus with Docker.
How do you use client/server mode and the REST API?
Beyond the web, Glances brings two superpowers for automation. The first is client/server mode: on the machine you want to watch you launch Glances in server mode (GLANCES_OPT: "-s", port 61209). From another computer you connect with glances -c IP_ADDRESS and see the remote machine in your own console. It is handy to review your remote servers without opening a browser on each one:
docker run -d --restart=unless-stopped -p 61209:61209 \
  -e GLANCES_OPT="-s" \
  -v /var/run/docker.sock:/var/run/docker.sock:ro \
  --pid host nicolargo/glances:4.5.5-full
The second is the REST API, available whenever the container runs in web mode. In Glances 4 it is served by FastAPI under the /api/4 path, with an endpoint per module. These requests return ready-to-consume JSON:
curl http://localhost:61208/api/4/cpu
curl http://localhost:61208/api/4/mem
curl http://localhost:61208/api/4/containers
With that API you can feed a service dashboard such as Homepage, trigger an alert from a script or store point-in-time metrics. Since port 61208 stays open without a password, do not expose it to the Internet as is. Publish it behind a reverse proxy with HTTPS and authentication, as explained in how to install Traefik with Docker Compose. The API also supports a JWT token and basic authentication if you need to protect it directly.
Glances or Netdata: which one to choose?
Both monitor a server from the browser, but they solve different needs. Glances is lightweight, single-screen and almost configuration-free: perfect for a quick look, checking a one-off server over SSH or consuming specific metrics through its API. Netdata, on the other hand, is an observability platform with thousands of high-resolution per-second metrics, automatic detection, historical charts and built-in alerts. In exchange it asks for more resources and shows a much denser interface.
The rule of thumb: if you want "the usual htop but on the web and with an API", stick with Glances; if you are after a full historical dashboard with alerts, go for Netdata. And if what you need is a minimal monitor for more than one server at once, with almost no footprint, look at the guide on how to install Beszel with Docker. They are not mutually exclusive: you can keep Glances on each machine for the immediate look and reserve Netdata or Prometheus for the history.
Frequently asked questions
Why does Glances not see my containers or the host processes?
Almost always it is because of two settings missing from the docker-compose.yml. To list containers you need to mount the Docker socket with -v /var/run/docker.sock:/var/run/docker.sock:ro; without that mount, the containers section shows up empty. And for the processes tab to show what runs on the host, and not just Glances itself, you have to start with pid: host. With both in place, the dashboard fills up completely.
Should I use the Glances latest tag?
Better not in production. The :latest tag gives you the newest version every time you rebuild, which can introduce changes without warning. Pin a specific version such as nicolargo/glances:4.5.5-full and upgrade when you decide; the -full suffix includes the optional dependencies (sensors, GPU) that the basic image leaves out. That way you control exactly what runs and stop an automatic update from breaking your dashboard.
How many resources does Glances use?
Very few for a home server. Being a single Python process that reads metrics with psutil, its memory footprint is modest and CPU usage stays low if you keep the refresh at 1 second or more. If you are worried about consumption, raise the refresh interval (for example to 5 seconds) and cap the container with Compose’s resource options. We explain it in the guide on resource limits and logging in Docker.
Conclusion
With a single docker-compose.yml you have Glances watching CPU, memory, disk, network and containers from the browser on port 61208, with the /api/4 REST API ready to automate and a healthcheck that confirms it is still up. It is the ideal tool for the quick look and for servers where you do not want to stand up a full observability stack. When you need history and alerts, scale up to Netdata or a Prometheus stack, and always protect the port behind a reverse proxy before exposing it.
Sources: [1] Official Glances documentation: Docker[1], [2] Glances repository on GitHub[2], [3] Official nicolargo/glances image on Docker Hub[3], [4] Glances package on PyPI[4].