How to install OpenObserve with Docker and alert on SLOs
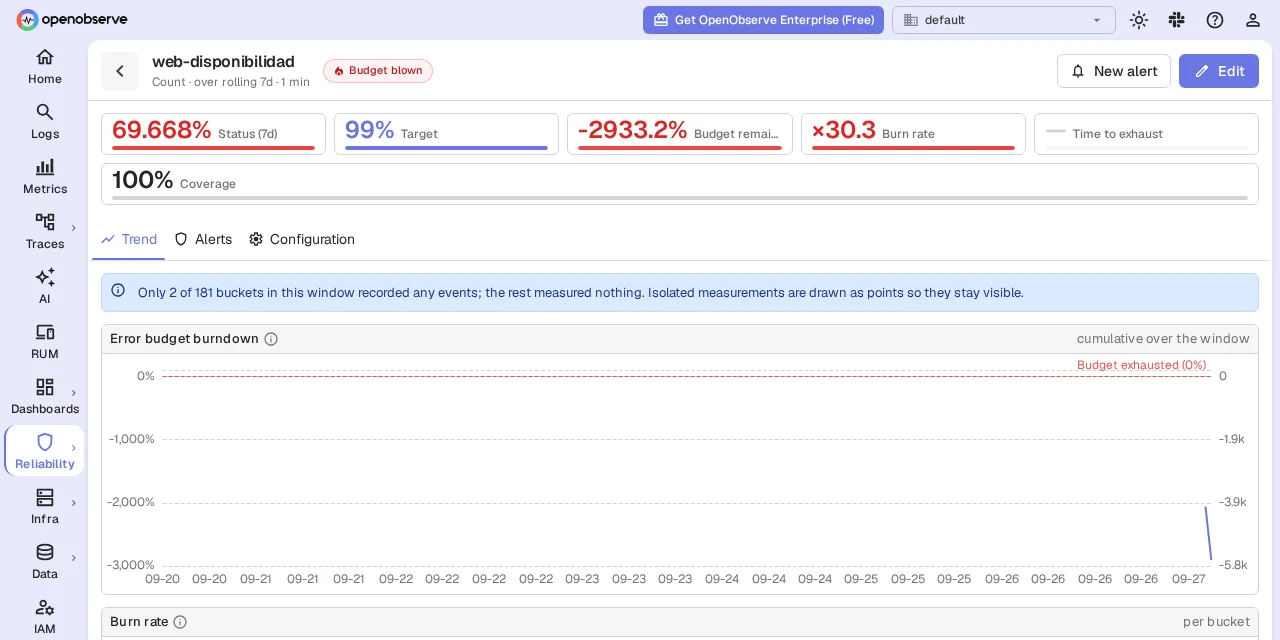
Table of contents
- Key takeaways
- What OpenObserve is and what version 1.0 brings
- Which part is AGPL and which part is Enterprise
- What you need before you start
- How to run OpenObserve with Docker Compose
- How to ship logs and metrics with Vector
- Why Vector 0.58 returns 401 with a correct password
- How to query logs with SQL and metrics with PromQL
- How to create an SLO with a burn-rate alert
- The availability SLO
- Why a new SLO shows "No data"
- The burn-rate alert
- The webhook destination and the SSRF filter
- How much memory and disk OpenObserve uses
- OpenObserve versus Grafana, Loki and Prometheus
- Frequently asked questions
- Are OpenObserve SLOs a paid feature?
- Which Docker image is the open source one?
- Can I use Fluent Bit or the OpenTelemetry Collector instead of Vector?
- Conclusion
- Sources
OpenObserve 1.0 is a single binary written in Rust that stores logs, metrics and traces, queries them with SQL and PromQL and, since 11 September 2026, computes SLOs with burn-rate alerts. This guide installs it with Docker Compose, ships an nginx’s logs and metrics to it with Vector, queries both, creates an availability SLO and trips its alert with injected errors. I tested it with the v1.0.4 image on an arm64 machine and note what it used and the four traps I hit.
Key takeaways
- The
public.ecr.aws/zinclabs/openobserve:v1.0.4image is the AGPL-3.0 edition, weighs 144 MB for arm64 and already includes SLOs and burn-rate alerts. - The official guide starts the Enterprise image, which has a different licence and is free up to 50 GB/day; if you want open source, swap the image.
- Vector 0.58 no longer substitutes
${VARIABLE}in its config: it sent the variable name as the password and every request got a 401 until I read it from a secret. - A new 7-day SLO showed "No data" until it backfilled its history, one day per pass; it took about 5 minutes to reach 100 % coverage.
- On an otherwise idle 18-core arm64 VM, OpenObserve accepted 2 million synthetic records at about 436,000 per second (median of 3), stored them in 12.4 MB of Parquet and never went above 665 MiB of memory.
What OpenObserve is and what version 1.0 brings
OpenObserve is an observability platform that stores telemetry as Parquet files, on local disk or in object storage, and serves it from a single process. Logs and traces are queried with SQL; metrics, with PromQL or SQL. The project README[1] pitches it as an alternative to Datadog, Splunk and Elasticsearch and states that "The open source edition is feature-complete and production-ready".
Version 1.0.0[2] came out on 11 September 2026. According to its notes, it is the first stable release of the 1.x line and gathers 375 commits (295 open source and 80 Enterprise) since 0.92.2. These are the changes that matter for this guide:
- SLOs: service level objectives with burn-rate alerts, over SQL counts, PromQL or time slices
- Composite alerts: an alert that combines other alerts
- Alert library: ready-made alerts you install in bulk
- Terraform and OpenTofu export of alerts and SLOs
- Synthetic monitoring: moves entirely into open source
Four patches have shipped since. 1.0.1 fixes how SLO status is written and 1.0.2, silencing during an alert’s pending period. 1.0.3 brings PromQL and OTLP series-identity fixes. 1.0.4, from 24 September[3], is the one I use here.
Which part is AGPL and which part is Enterprise
OpenObserve ships in two editions under different licences. The open source edition is AGPL-3.0, according to the repository’s LICENSE file. The Enterprise edition uses its own commercial agreement, which the README describes as "not AGPL". The licence and pricing page[4] makes it free up to 50 GB/day of ingestion, about 1.5 TB a month, commercial use included.
Above that it requires a paid licence, and if you exceed the limit more than 3 times in a calendar month it blocks searches.
| Feature | AGPL edition | Enterprise edition |
|---|---|---|
| Logs, metrics, traces, dashboards | Yes | Yes |
| SLOs and burn-rate alerts | Yes (tested) | Yes |
| Composite alerts and alert library | Yes | Yes |
| SSO (OIDC, SAML, LDAP) and advanced RBAC | No | Yes |
| Audit trail | No | Yes |
| Federated search across clusters | No | Yes |
| Sensitive data redaction | No | Yes |
| Incident management, SRE agent, AI assistant | No | Yes |
| Automatic metrics downsampling | No | Yes |
The table comes from the Enterprise features list[5]. The 1.0.0 notes tag both SLO features with a pull request number from the open repository and none from Enterprise. I checked it in practice: the AGPL image shows Reliability > SLOs and the burn-rate alert form.
The trap is in the getting started guide[6]. Its docker run uses o2cr.ai/openobserve/openobserve-enterprise:latest, so anyone who copies that command installs the Enterprise edition without knowing it. The same page lists both images: openobserve-enterprise and openobserve, which is the AGPL one.
What you need before you start
You need Docker with the Compose plugin and about 200 MB of disk for the images. I tested on an arm64 Linux VM with 18 cores and 47 GB of RAM, shared with other jobs, with Docker Compose 2.40.3. The setup has five pieces:
- OpenObserve 1.0.4, the AGPL image, with a volume for data
- nginx 1.30.5 as the application that produces logs and metrics
- Vector 0.58.0 as the agent: it reads the container’s logs through the Docker socket and scrapes nginx’s
stub_statuspage - A load generator running
wgetin a loop - A webhook receiver: a 12-line Python HTTP server that prints every POST, to watch the alert arrive
If you already run Prometheus in Docker, the remote write in the metrics step works the same from it.
How to run OpenObserve with Docker Compose
OpenObserve needs only three variables to start in single-node mode: the root user’s email and password and the data directory. With ZO_LOCAL_MODE at its default it keeps metadata in SQLite inside that directory. Create the password first, in a file for Vector and in .env for Compose:
printf '%s' "Aa9-$(openssl rand -hex 12)" > o2_password
echo "O2_PASSWORD=$(cat o2_password)" > .env
chmod 600 .env
The Aa9- prefix is not decoration. My first attempt used openssl rand -base64 24 with no symbols, and OpenObserve went into a restart loop with this panic: ZO_ROOT_USER_PASSWORD is too weak: Password must be 8-128 characters and contain at least one lowercase letter, one uppercase letter, one digit, and one special character. This is the OpenObserve service in compose.yaml:
services:
  openobserve:
    image: public.ecr.aws/zinclabs/openobserve:v1.0.4
    environment:
      ZO_ROOT_USER_EMAIL: admin@example.com
      ZO_ROOT_USER_PASSWORD: ${O2_PASSWORD}
      ZO_DATA_DIR: /data
      ZO_TELEMETRY: "false"
      ZO_MMDB_DISABLE_DOWNLOAD: "true"
      ZO_SKIP_SSRF_CHECKS: "true"
      ZO_WEB_URL: http://localhost:5080
    volumes:
      - o2-data:/data
    ports:
      - "127.0.0.1:5080:5080"
    restart: unless-stopped

volumes:
  o2-data:
Each extra variable answers something I saw or that the environment variables list[7] states:
ZO_TELEMETRY: defaults totrueand sends anonymous telemetryZO_MMDB_DISABLE_DOWNLOAD: the docs say it defaults totrue, but without it my first start downloaded the GeoLite2 City and ASN databases, 74 MB, and started at 325 MiB of memory; with it, nothing and about 145 MiBZO_SKIP_SSRF_CHECKS: allows webhooks to private networks; without it, the alert destination fails (explained below)ZO_WEB_URL: the address used in notification links
On my machine the containers carry a name prefix and the published port is different, because the box is shared; the rest of the files is what I ran. Start the service and check that it answers:
docker compose up -d openobserve
curl -s http://127.0.0.1:5080/healthz
It returned {"status":"ok"} within a second. On that first start the log shows the SQLite migrations and a line worth reading: Caches info: Disk max size 500.00 GB, MEM max size 11.76 GB.
The memory cache is sized at 25 % of the host’s RAM, not the container’s, so on a shared server you should cap the container. The web UI is at http://localhost:5080/web/ with the root user. The image is distroless and ships no shell, so it cannot take a Compose healthcheck that runs curl inside.
How to ship logs and metrics with Vector
Vector collects the nginx container’s logs through the Docker socket, parses them with the parse_nginx_log function and sends them to OpenObserve’s _json endpoint; the stub_status metrics go over Prometheus remote write. Both paths are in the Vector ingestion guide[8] and the remote write guide[9]. Add these services to the same compose.yaml:
  web:
    image: public.ecr.aws/nginx/nginx:1.30-alpine
    container_name: web
    volumes:
      - ./nginx.conf:/etc/nginx/conf.d/default.conf:ro

  vector:
    image: ghcr.io/vectordotdev/vector:0.58.0-alpine
    secrets: [o2_password]
    volumes:
      - ./vector.yaml:/etc/vector/vector.yaml:ro
      - /var/run/docker.sock:/var/run/docker.sock:ro
    command: ["--config", "/etc/vector/vector.yaml"]
    depends_on: [openobserve, web]

secrets:
  o2_password:
    file: ./o2_password
I use the ECR and GHCR images because Docker Hub answered 429 Too Many Requests during the test; they are the same versions. The nginx.conf returns 200 on /, 503 on /fail and exposes stub_status:
server {
    listen 80;
    location = /stub_status { stub_status; }
    location /fail { return 503; }
    location / { return 200 "ok\n"; }
}
The first half of vector.yaml declares the secret, the two sources and the transform. The transform drops the Docker labels, which OpenObserve turned into 11 label_* columns per record:
secret:
  o2:
    type: directory
    path: /run/secrets

sources:
  web_logs:
    type: docker_logs
    include_containers: ["web"]
  web_metrics:
    type: nginx_metrics
    endpoints: ["http://web/stub_status"]
    scrape_interval_secs: 15

transforms:
  parsed:
    type: remap
    inputs: [web_logs]
    source: |
      p, err = parse_nginx_log(.message, "combined")
      if err == null { . = merge(., p) }
      del(.label)
      del(.container_created_at)
The second half defines the two sinks. OpenObserve’s default organisation is called default and the nginx stream is created by the first request:
sinks:
  o2_logs:
    type: http
    inputs: [parsed]
    uri: http://openobserve:5080/api/default/nginx/_json
    method: post
    auth:
      strategy: basic
      user: admin@example.com
      password: SECRET[o2.o2_password]
    compression: gzip
    encoding:
      codec: json
      timestamp_format: rfc3339
  o2_metrics:
    type: prometheus_remote_write
    inputs: [web_metrics]
    endpoint: http://openobserve:5080/api/default/prometheus/api/v1/write
    healthcheck:
      enabled: false
    auth:
      strategy: basic
      user: admin@example.com
      password: SECRET[o2.o2_password]
Why Vector 0.58 returns 401 with a correct password
The first version of this file had password: ${O2_PASSWORD} and passed the variable to the container. Every request ended in 401 and Not retriable; dropping the request, although the same password worked with curl. The cause is on Vector’s environment variables page[10]: "By default, environment variable interpolation is disabled (the default changed in v0.57.0)". Vector was sending the text ${O2_PASSWORD} as is.
There are two ways out: start with --dangerously-allow-env-var-interpolation or use the secrets backend[11]. I picked the second: the directory backend reads /run/secrets, where Compose mounts the secret, and SECRET[o2.o2_password] substitutes it when the config loads. Disabling the metrics sink’s healthcheck avoids another startup error: Vector’s check got 405 Method Not Allowed from the remote write endpoint, while the real requests returned 200.
How to query logs with SQL and metrics with PromQL
Logs are queried with SQL from Logs in the UI or through the _search API, which expects the time range in microseconds. This script wraps the call; the first argument is the query and the second, the minutes to look back:
#!/bin/sh
MIN=${2:-15}
END=$(($(date +%s) * 1000000)); START=$((END - MIN * 60 * 1000000))
curl -s -u "admin@example.com:$(cat o2_password)" \
  http://127.0.0.1:5080/api/default/_search \
  -H 'Content-Type: application/json' \
  -d "{\"query\":{\"sql\":\"$1\",\"start_time\":$START,\"end_time\":$END}}"
With ./q.sh "SELECT status, count(*) AS n FROM nginx GROUP BY status" I got 291 responses with 200 and 5 with 503 in the first minutes. The fields parse_nginx_log produces (status, request, size, agent) arrive typed, so status < 500 compares numbers without casts. Metrics come from the Prometheus-compatible API:
curl -s -u "admin@example.com:$(cat o2_password)" \
  http://127.0.0.1:5080/api/default/prometheus/api/v1/query \
  --data-urlencode 'query=sum(rate(nginx_http_requests_total[5m]))'
The response has the Prometheus format ("resultType":"vector", 17.6 requests per second in my case). That is why a Grafana in Docker can use that path as a Prometheus data source if you prefer its dashboards. Each Vector metric shows up as its own stream: nginx_http_requests_total, nginx_connections_active and six more.
How to create an SLO with a burn-rate alert
An OpenObserve SLO measures an indicator (SLI): the percentage of good events over the total in a rolling window of 7, 30 or 90 days. The burn-rate alert fires when the error budget is being spent faster than the window allows. The SLO documentation[12] defines burn rate as the error rate divided by 100 - target: with a 99 % target, a 5 % error rate is a burn rate of ×5. If error budgets are new to you, start with how SLOs and error budgets work.
The availability SLO
This SLO counts as good every nginx request that does not return a 5xx, excludes Vector’s stub_status reads and asks for 99 % over 7 days with one-minute slices. I created it through the API:
{
  "name": "web-disponibilidad",
  "sli_type": "count",
  "config": {"source": {"mode": "single_query", "query": {
    "stream": "nginx",
    "stream_type": "logs",
    "scope": "status IS NOT NULL AND request NOT LIKE '%stub_status%'",
    "good_expr": "status < 500"
  }}},
  "target": 99,
  "window_secs": 604800,
  "slice_interval_secs": 60
}
Save that JSON as slo.json, send it and enable the SLO with the ID the first call returns:
A="admin@example.com:$(cat o2_password)"
curl -s -u "$A" -H 'Content-Type: application/json' -d @slo.json \
  http://127.0.0.1:5080/api/default/slos
curl -s -u "$A" -X PUT \
  "http://127.0.0.1:5080/api/default/slos/7509928088713560064/enable?value=true"
The second call is not redundant. The SLO created through the API was stored with "enabled": false, and the POST response ("SLO saved") does not say so.
Why a new SLO shows "No data"
Right after creation, the SLO page showed Frozen: not enough coverage at 14 % coverage. OpenObserve only reports an SLI when at least 90 % of the window is measured (ZO_SLO_MIN_COVERAGE), and it backfills history in one-day chunks (ZO_SLO_BACKFILL_CHUNK_SECS). In my case coverage went through 29 %, 43 %, 57 %, 71 % and 86 % to 100 % in about 5 minutes, one pass per day of window. Days without data count as measured with zero events, not as gaps, because this is a count SLO.
With full coverage, the load generator’s 2 % of errors and a batch of injected errors were counted. The SLO showed a 69.4 % SLI, a ×30.6 burn rate and −2956.8 % of budget remaining. OpenObserve does not clamp that number to zero: the docs explain that "just barely blown" and "catastrophically blown" are different situations.
The burn-rate alert
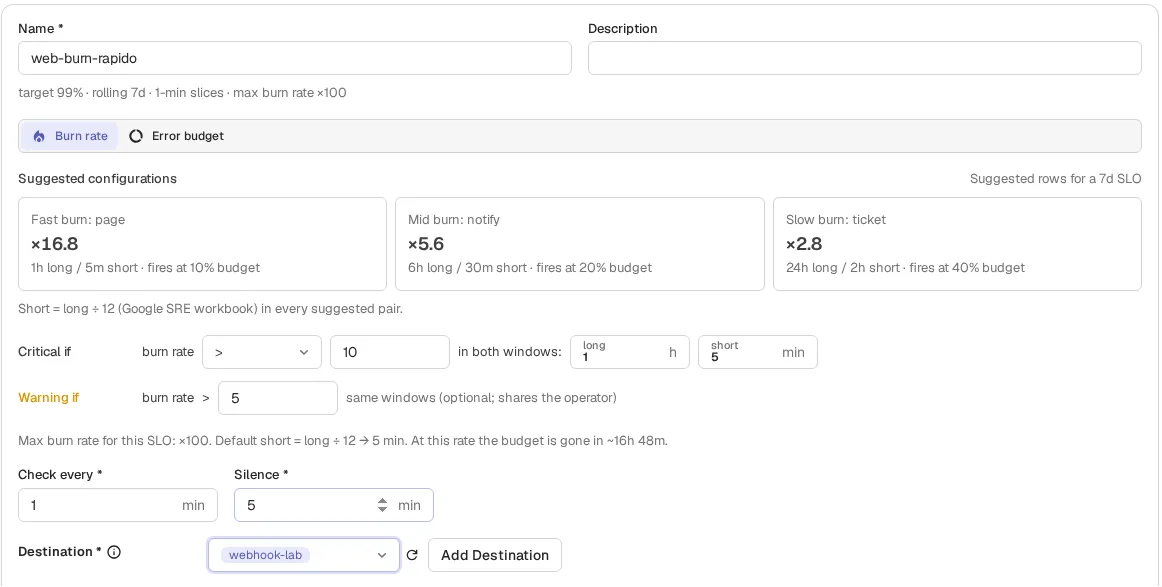
SLO alerts are created from the SLO’s own page, on the Alerts tab, and they run no queries: they read the measurement the SLO already stored. The form offers three configurations with windows from the SLO alerting guide[13], which follows the Google SRE workbook (short window = long ÷ 12). For a 7-day SLO:
| Preset | Threshold | Windows | Budget spent when it fires |
|---|---|---|---|
| Fast burn: page | ×16.8 | 1 h / 5 min | ~10 % |
| Mid burn: notify | ×5.6 | 6 h / 30 min | 20 % |
| Slow burn: ticket | ×2.8 | 24 h / 2 h | 40 % |
I set a critical level above ×10 and a warning above ×5, with 1 h and 5 min windows, a check every minute and a 5-minute silence. Both windows must exceed the threshold for the alert to fire, and the final level is the less severe of the two: if the short window has already recovered, the alert stays quiet.
The webhook destination and the SSRF filter
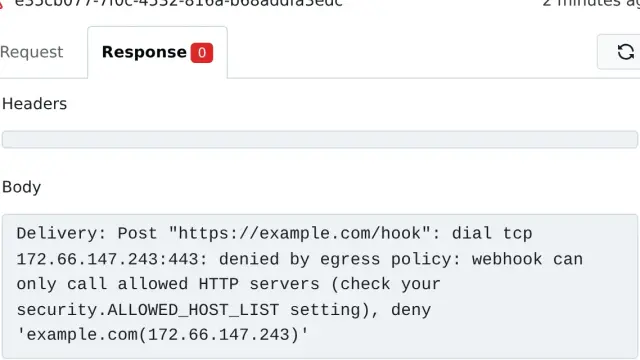
The alert destination is a webhook to the hook container on the same network, and OpenObserve rejected it on save: Destination URL blocked by SSRF guard: Access to private IP address 172.25.0.6 is not allowed. The server-side request forgery (SSRF) protection blocks private networks by default. ZO_SSRF_ALLOW_LOOPBACK only opens 127.0.0.1; for a service on another private IP, such as an ntfy or Gotify on your network, you need ZO_SKIP_SSRF_CHECKS=true, which is what the compose.yaml above carries. Enable it only if you trust every destination URL configured on the instance.
To trigger the alert I started a container that requests /fail 40 times every 5 seconds, around 50 % of all requests. lab_default is the network Compose creates for a project in the lab directory:
docker run -d --name chaos --network lab_default alpine:3.24 sh -c \
  'while true; do for i in $(seq 1 40); do
     wget -qO- http://web/fail >/dev/null 2>&1; done; sleep 5; done'
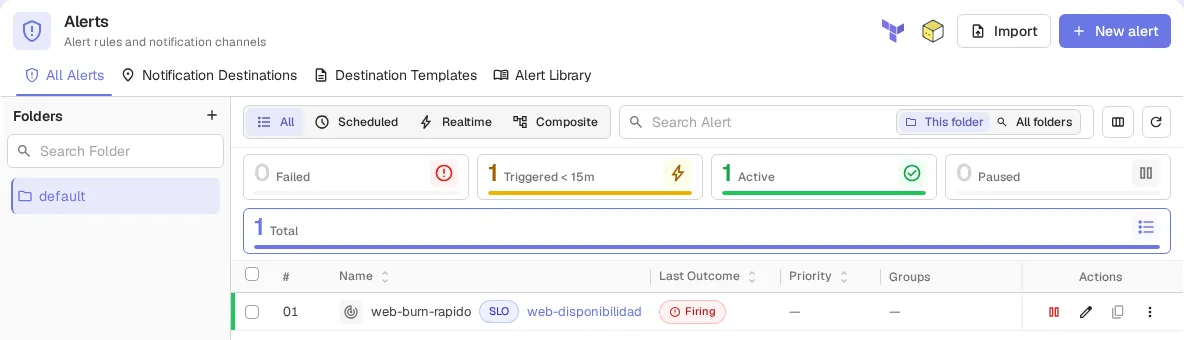
While the one-hour window lacked coverage, the OpenObserve log kept repeating SLO alert evaluation frozen (unobserved): frozen, it neither fires nor resolves. Halfway through the test the VM was suspended for 37 minutes, so I cannot give you a clean time to fire. With the VM resumed, 11 minutes later, the webhook received this:
{"title": "[critical] web-burn-rapido on ",
 "severity": "critical",
 "rows": [{"slo_name": "web-disponibilidad", "slo_window": "7d",
           "slo_target": 99.0, "burn_rate": 14.910179640718567,
           "sli": 85.08982035928143,
           "error_budget_remaining": -1391.0179640718568}],
 "fields": {"Threshold": "= 0", "Value": "14.910179640718567"}}
The burn rate in the notification (×14.9) is the one from the deciding window, not the 7-day one (×30), and the SLI and budget come from that same window. The default template writes Threshold: = 0 and a title that ends in on, leftovers from the query-alert format. If the notification goes to a channel people read, create your own template with the slo_* fields.
How much memory and disk OpenObserve uses
With the lab’s nginx traffic, about 17 requests per second, OpenObserve stayed under 235 MiB. To measure ingestion and disk under more volume I also sent 2 million synthetic records through the _json API. I repeated the load 3 times, each on a fresh volume with OpenObserve alone, and a fourth time with the whole setup running.
The machine is an 18-core arm64 Linux VM with 47 GB of RAM (OrbStack on Apple silicon), with the Docker volume on btrfs over a virtio disk. I only accepted runs that started with a one-minute load average below 3; they started between 0.54 and 1.00, and ingestion itself raises the load while it lasts. Memory figures come from docker stats every second and disk figures from du on the volume:
| Measure | Value |
|---|---|
openobserve:v1.0.4 image (arm64) |
144 MB |
| Memory right after start, no data (3 starts) | 140–182 MiB |
| Memory with nginx traffic and the SLO, at 5, 10 and 15 minutes | 196, 227 and 232 MiB |
| Ingesting 2 million records (median of 3) | 435,937 records/s, 88.7 MB/s |
| Peak memory during ingestion (4 runs) | 532–665 MiB |
| Memory 5 to 25 minutes after ingestion | 278–369 MiB |
| Vector memory | 46–73 MiB |
| 2 million records: original size by OpenObserve’s count | 355.6 MB |
| The same records as Parquet | 12.36 MB |
SQLite metadata (/data/db) |
6 MB |
The 29-to-1 disk ratio is my data’s, not a promise. The synthetic records repeat five paths, four status codes and a single user agent. Parquet compresses better the more a column’s values repeat; real logs with free-text messages will compress less. Records spend a few minutes in the write-ahead log (WAL) and in memory before becoming Parquet: ZO_MAX_FILE_RETENTION_TIME defaults to 600 s.
The three runs gave 426,145, 435,937 and 451,119 records per second, 4.4 to 4.7 s each. The fourth, with Vector, nginx and the SLO running, gave 475,103.
The MB/s figure counts the uncompressed JSON the client sends. The client is a Python script with 4 threads on the same machine, sending batches of 5000 records of about 200 bytes and 8 fields. OpenObserve acknowledges each batch once it is in the WAL, not in Parquet. Do not read the figure as production capacity: with larger records, more fields or a client on another machine the number will differ.
Queries over the 2 million records, already in Parquet, took 6 to 9 ms according to the API’s took field (median of 5 repeats after a first cold one). A count(*) with the 99th percentile of duration_ms took 9 ms (29 ms cold) and a GROUP BY status, 6 ms (7 ms cold). I dropped a third query because the result cache answered it from the second run on.
OpenObserve versus Grafana, Loki and Prometheus
The practical difference is how many pieces you maintain. With the Grafana stack, logs go to Loki, metrics to Prometheus, dashboards to Grafana and alert routing to Alertmanager. SLOs need their own rules or one more tool. We have separate guides for Loki with Docker, Prometheus and Grafana; OpenObserve folds the four roles into one process and one volume.
| Criterion | OpenObserve 1.0 | Grafana + Loki + Prometheus |
|---|---|---|
| Services to maintain | 1 | 3, plus Alertmanager |
| Log query language | SQL | LogQL |
| Metrics query language | PromQL or SQL | PromQL |
| SLOs with burn-rate alerts | Built in | Recording and alerting rules by hand |
| Storage | Parquet on disk or S3 | Loki’s and the Prometheus TSDB’s own formats |
| Licence | AGPL-3.0 (Enterprise separate) | Grafana and Loki AGPL-3.0, Prometheus Apache-2.0 |
| Ecosystem and docs | Young, 1.x line since September 2026 | Mature and widespread |
I would pick OpenObserve for a single server or a small cluster where you want logs, metrics and SLOs without running four services. I would stay with the Grafana stack if you already run it or depend on community dashboards and exporters. The same goes if you need SSO and role-based access control without paying, because in OpenObserve that is Enterprise.
Frequently asked questions
Are OpenObserve SLOs a paid feature?
No. The 1.0.0 notes attribute SLOs and burn-rate alerts to the open repository, and the AGPL openobserve:v1.0.4 image includes them: I created one and made its alert fire with it. What is Enterprise includes SSO, advanced RBAC, the audit trail and incident management.
Which Docker image is the open source one?
public.ecr.aws/zinclabs/openobserve is the AGPL-3.0 edition. openobserve-enterprise, the one the official guide’s docker run uses, has a commercial licence and is free up to 50 GB/day of ingestion.
Can I use Fluent Bit or the OpenTelemetry Collector instead of Vector?
Yes, the ingestion docs cover both, and OpenObserve accepts OTLP. In this test I only used Vector; if you already have Fluent Bit collecting logs, point it at the same _json endpoint or the Elasticsearch-compatible one.
Conclusion
OpenObserve 1.0 delivers what it promises for a single node. It is a 144 MB container with logs in SQL, metrics in PromQL and SLOs with burn-rate alerts in the AGPL edition. With my load it stayed under 370 MiB at rest.
The four traps I found will cost you an afternoon if you don’t know them. They are the Enterprise image in the official guide, Vector 0.58’s disabled interpolation, the password policy and the webhooks’ SSRF filter.
The sensible next step is moving it to S3 storage and testing retention with your own logs before you switch Loki off.
This guide is also available in Spanish.
Sources: [1] OpenObserve v1.0.0 release notes[2], [2] OpenObserve v1.0.4 release[3], [3] OpenObserve README and licence[1], [4] OpenObserve: License and Pricing[4], [5] OpenObserve: Enterprise Features[5], [6] OpenObserve: Getting Started[6], [7] OpenObserve: Environment Variables[7], [8] OpenObserve: Service Level Objectives[12], [9] OpenObserve: Alerting on SLOs[13], [10] OpenObserve: Vector[8], [11] OpenObserve: Prometheus remote write[9], [12] Vector: Environment Variables[10], [13] Vector: Secrets[11].
Sources
Source code
Access all the source code for this post on GitHub.
View on GitHub