How to upgrade from Grafana 12 to Grafana 13 in Docker without breaking dashboards
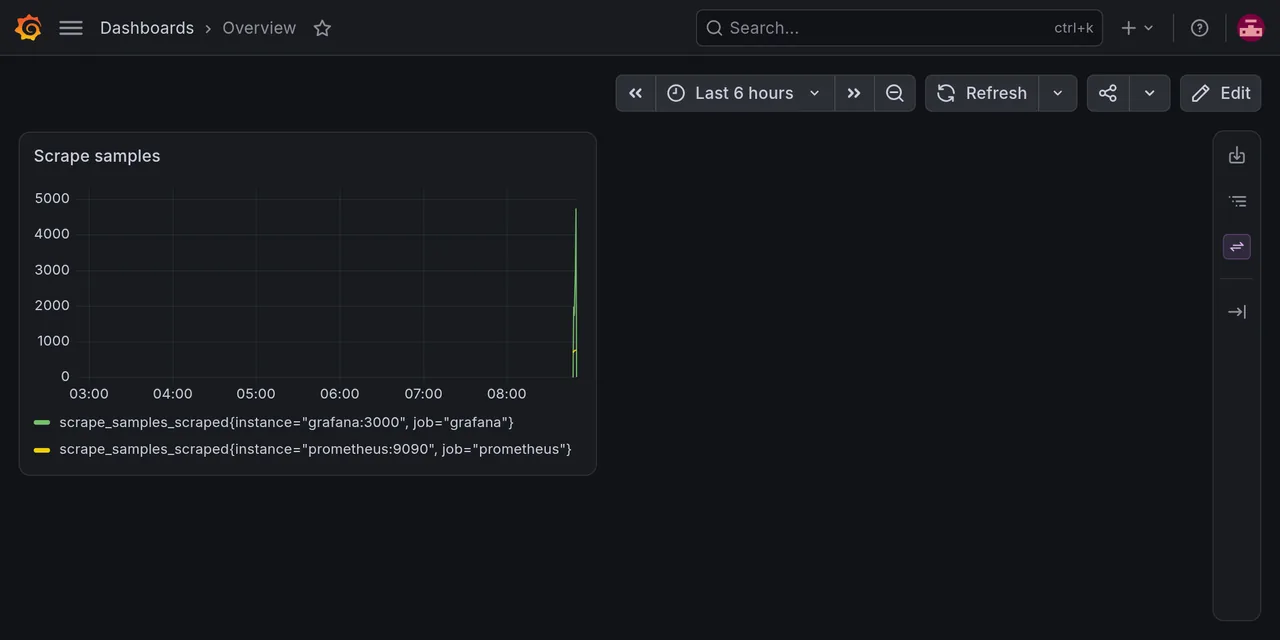
Table of contents
- Key takeaways
- What changes in Grafana 13 and what affects you
- Step 1: set up a Grafana 12 with a provisioned data source and dashboards
- Step 2: write the script that uses numeric ids
- Step 3: back up grafana.db
- Step 4: bump the image to Grafana 13 and see what breaks
- Step 5: fix the calls to use uid
- How to roll back if something fails
- What to check outside my lab
- Frequently asked questions
- Which Grafana 13 version should I install?
- Do dashboards break when upgrading to Grafana 13?
- Can I keep using the by-numeric-id APIs?
- Conclusion
- Sources
Grafana 13, released on 14 April 2026, disables by default the data source APIs that are called with the numeric id, and that is the breakage you will actually notice when upgrading from Grafana 12. I tested the jump from 12.4.12 to 13.2.3 in Docker with a provisioned Prometheus and two dashboards: the dashboards kept working and a script that used numeric ids stopped working. There is also a Spanish version.
Key takeaways
- The official guide says: "Data source APIs that reference data sources by numeric
idhave been deprecated since Grafana 9. In Grafana 13, they’re disabled by default." - In my test, the 2 by-id calls (
/api/datasources/1and the proxy/api/datasources/proxy/1/...) went from 200 to 404. The 2 equivalent by-uid calls returned 200. - Both dashboards, one provisioned and one created through the API with the data source written by name, opened the same in 13.2.3.
- The backup is a single file: my
grafana.dbwas 1,495,040 bytes, and restoring it put Grafana 12.4.12 back in its previous state. - The target version matters: 13.0.0 had a migration bug with Git Sync, and the guide says to go to 13.0.1 or later.
What changes in Grafana 13 and what affects you
The Grafana 13.0 upgrade guide[1] lists the breaking changes. These are the ones that matter for a Docker install, with what I checked for each:
| Change | Who notices | What I tested |
|---|---|---|
| By-numeric-id data source APIs disabled | Scripts, Terraform, in-house tools | Yes: 404 on both calls |
| Image Renderer plugin stops working as a plugin | Anyone rendering images or scheduled reports | No: it is a separate service |
/api deprecated in favour of /apis |
Long-term integrations | Only saw that /apis answers 200 |
| Custom roles with deprecated permissions may fail | Anyone using custom RBAC roles | No: needs custom roles |
| 13.0.0 migration bug with Git Sync | Anyone using Git Sync | No: I do not use it |
On /api, the guide clarifies that "Legacy APIs are not being disabled for the moment", so you do not have to migrate everything at once. I found no section about pre-Scenes dashboards in the upgrade guide; what the what’s-new page says is that existing dashboards "are migrated to the new schema when you open them".
Step 1: set up a Grafana 12 with a provisioned data source and dashboards
To reproduce the scenario I ran two services with Docker Compose: Prometheus v3.15.0 and Grafana 12.4.12. If you do not have the stack yet, start with how to install Grafana with Docker and how to install Prometheus with Docker. The minimal docker-compose.yml:
services:
  prometheus:
    image: prom/prometheus:v3.15.0
    volumes: ["./prometheus.yml:/etc/prometheus/prometheus.yml:ro"]
  grafana:
    image: grafana/grafana:${GF_TAG:-12.4.12}
    ports: ["29400:3000"]
    environment:
      GF_SECURITY_ADMIN_PASSWORD: admin
    volumes:
      - gfdata:/var/lib/grafana
      - ./prov:/etc/grafana/provisioning:ro
      - ./dash:/var/lib/grafana/dashboards:ro
volumes: {gfdata: {}}
The data source is provisioned with a fixed uid. That decision saves you the most at upgrade time, because a stable uid survives recreating the server:
apiVersion: 1
datasources:
  - name: Prometheus
    type: prometheus
    access: proxy
    url: http://prometheus:9090
    uid: prom-main
    isDefault: true
I added a provisioned dashboard (Overview, with the data source by uid) and created another through the API (Legacy by name) with "datasource": "Prometheus", the old way of referring to a data source by its name. That second dashboard stands in for the ones that have sat in your database for years.
Step 2: write the script that uses numeric ids
The automation script that mimics the typical case looks up the data source by its id and runs a query through the proxy with that same id:
curl -s -u admin:admin -w '\nHTTP %{http_code}\n' \
  http://localhost:29400/api/datasources/1
curl -s -u admin:admin -w '\nHTTP %{http_code}\n' \
  "http://localhost:29400/api/datasources/proxy/1/api/v1/query?query=up"
On Grafana 12.4.12 both return HTTP 200: the first with the data source JSON ("id":1,"uid":"prom-main") and the second with "status":"success" and the up series.
Step 3: back up grafana.db
The guide recommends: "We recommend that you back up your Grafana database so that you can roll back to a previous version, if required." With SQLite, the database is the grafana.db file in the volume. I stop Grafana to copy it without half-written pages:
docker compose stop grafana
docker run --rm -v b8p14_gfdata:/v -v "$PWD":/b alpine \
  cp /v/grafana.db /b/grafana.db.bak-12.4.12
docker compose start grafana
The volume name starts with the Compose project prefix (b8p14 in my case). If you use MySQL or PostgreSQL, take the dump with mysqldump or pg_dump instead of copying a file. Keep your grafana.ini or the GF_* environment variables too.
Step 4: bump the image to Grafana 13 and see what breaks
I changed the image tag to 13.2.3, the latest 13.x on Docker Hub on 7 October 2026, and recreated only the Grafana service:
GF_TAG=13.2.3 docker compose up -d grafana
curl -s localhost:29400/api/health
Health returned "version": "13.2.3" and "database": "ok". The logs show the database migrations running at startup, with no errors. Then I repeated the script from step 2:
== GET /api/datasources/1
{"message":"Not found"}
HTTP 404
== GET /api/datasources/proxy/1/api/v1/query?query=up
{"message":"Not found"}
HTTP 404
The message is a generic Not found with no hint about the cause, which is why it helps to know in advance that this is it. A script that runs curl -s and never checks the status code would fail silently. The dashboards, on the other hand, were untouched: Overview and Legacy by name opened and drew their series.
Step 5: fix the calls to use uid
The fix is to resolve the uid once and call the by-uid routes. If you only know the data source name, the /api/datasources/name/<name> route still works and gives you the uid:
G=http://localhost:29400
UID_DS=$(curl -s -u admin:admin \
  $G/api/datasources/name/Prometheus \
  | python3 -c 'import json,sys;print(json.load(sys.stdin)["uid"])')
curl -s -u admin:admin -o /dev/null -w '%{http_code}\n' \
  "$G/api/datasources/uid/$UID_DS"
curl -s -u admin:admin -o /dev/null -w '%{http_code}\n' \
  "$G/api/datasources/proxy/uid/$UID_DS/api/v1/query?query=up"
Both returned 200 on Grafana 13.2.3. It is better to store the uid in your configuration (in my provisioning it is prom-main) than to resolve it on every run. The routes are described in the data source HTTP API[2].
If you cannot touch the script today, there is a temporary way out. The guide says it is re-enabled with the datasourceLegacyIdApi flag. I tested it with GF_FEATURE_TOGGLES_ENABLE=datasourceLegacyIdApi: both by-id calls returned 200 again. Keep in mind that the flag and the deprecated APIs will be removed in a future release, so it buys time and is not a place to stay.
How to roll back if something fails
Restoring is the reverse of the backup: stop Grafana, put the file back in the volume and start the previous tag. I tested it after upgrading to 13.2.3:
docker compose stop grafana
docker run --rm -v b8p14_gfdata:/v -v "$PWD":/b alpine sh -c \
  'cp /b/grafana.db.bak-12.4.12 /v/grafana.db && chown 472:0 /v/grafana.db'
GF_TAG=12.4.12 docker compose up -d grafana
Health went back to 12.4.12 and the by-id calls returned 200 again. The chown 472:0 is needed because the Grafana user in the image is 472. Without the backup there is no way back. Grafana 13 migrates the schema: my database grew from 1,495,040 to 1,650,688 bytes at startup. I did not try opening that file with version 12.
What to check outside my lab
My lab does not cover two changes in the guide, so check them before you upgrade:
- Image Renderer. If you render images or scheduled reports, the guide says to deploy it as a standalone service. JWT authentication is also on by default and needs a non-empty value in
[rendering] renderer_token. - Custom roles. Make sure no global role carries
datasources:uid:<uid>,fixed:annotations.dashboard:writer,fixed:annotations.dashboard:readerorannotations:*. The guide says to recreate data source permissions on non-global roles.
If you also centralise logs, see how to centralise logs with Grafana Loki in Docker: Loki data sources are subject to the same id-to-uid change.
Frequently asked questions
Which Grafana 13 version should I install?
The latest 13.x available. On 7 October 2026 it was 13.2.3. Avoid 13.0.0 if you use Git Sync: its migration could lose dashboards and folders, and the guide says to upgrade to 13.0.1.
Do dashboards break when upgrading to Grafana 13?
Not in my test. A provisioned dashboard with the data source by uid and another created through the API with the data source by name opened the same. What breaks are the API calls by numeric id.
Can I keep using the by-numeric-id APIs?
Only if you enable the datasourceLegacyIdApi flag, and it is temporary: Grafana will remove the APIs and the flag in a future release. Migrate your scripts to uid.
Conclusion
Upgrading from Grafana 12 to 13 in Docker is a tag change with a single breakage that I tested: scripts that call data sources by numeric id return 404. Back up grafana.db, move to the latest 13.x, switch the calls to uid and keep the backup until everything works.
Before you upgrade, search for /api/datasources/ followed by a number in your scripts, in Terraform and in any tool that talks to Grafana. That search tells you whether you are affected.
Sources: [1] Upgrade to Grafana v13.0[1], [2] What’s new in Grafana v13.0[3], [3] Deprecated data source APIs disabled by default[4], [4] Data source HTTP API[2], [5] Grafana provisioning[5], [6] grafana/grafana tags on Docker Hub[6], [7] v13.2.3 release on GitHub[7].