How to install Gatus with Docker Compose, monitoring as code vs Uptime Kuma
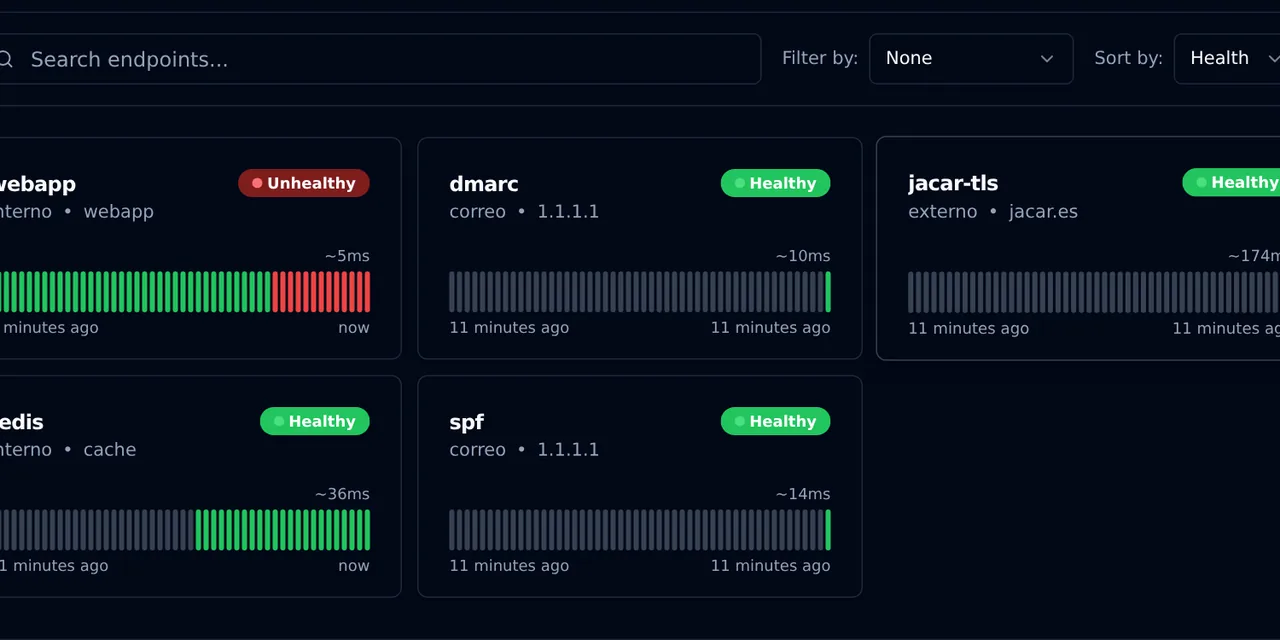
Table of contents
- Key takeaways
- What Gatus is and how it differs from a monitor with a UI
- What you need before you start
- How to install Gatus with Docker Compose
- How to set up persistence and the alert
- How to define the HTTP, TCP and certificate checks
- How to watch SPF and DMARC with the new DNS TXT check
- How to start Gatus and confirm it loads the configuration
- What happens when a service goes down
- How to validate the configuration before you commit
- Limitations I hit during the test
- Gatus or Uptime Kuma: which one to pick
- Frequently asked questions
- Can Gatus use PostgreSQL instead of SQLite?
- Does Gatus restart failing containers?
- Can I monitor services Gatus cannot reach over the network?
- Conclusion
- Sources
Gatus is a self-hosted uptime monitor configured entirely in YAML: each service is an endpoint with conditions, and the alert fires after three failures in a row. This guide installs it with Docker Compose and v5.37.0, released on 24 September 2026, with SQLite persistence, HTTP, TCP and certificate checks, the new DNS TXT query type, and a webhook that receives the alerts. I ran all of it on 27 September 2026, including a deliberate nginx outage. At the end you will find a comparison with Uptime Kuma and the Spanish version of this guide.
Key takeaways
- The
ghcr.io/twin/gatus:v5.37.0image is 24.4 MB, ships an arm64 variant and has no shell: you configure it only through mounted files. - When
GATUS_CONFIG_PATHpoints to a directory, Gatus merges every.yamlin it, so alerts, endpoints and DNS checks can live in separate files. - Without
storage, history lives in memory and is lost on restart; with SQLite on a volume it survived restarts and a crash loop. - With checks every 10 s and thresholds of 3 failures and 2 successes, the alert arrived 30.0 s after I stopped nginx and the resolution 19.9 s after I started it (medians of 5 rounds).
- A YAML error picked up by the hot reload kills the process with
panicand exit code 2; validate the configuration before you push it. - With five equivalent checks, Gatus used a median of 25 MiB of RAM and Uptime Kuma 2.5.5 used 123 MiB, about 5 times more.
What Gatus is and how it differs from a monitor with a UI
Gatus is a Go program that sends requests to your services on an interval. On each response it evaluates conditions: the status code, the body, the response time, the IP or the time left on the certificate. The Gatus README[1] explains why you need it next to metrics: "Neither of these can tell you that there’s a problem if there are no clients actively calling the endpoint". If nobody calls your API, Prometheus sees no errors; Gatus does, because it generates the traffic itself.
The difference from Uptime Kuma is where the configuration lives. In Uptime Kuma you create monitors through forms and they are stored in its database. Gatus has no forms: the dashboard is read-only and everything comes from files you can review in a pull request, copy between environments and restore with git checkout.
What you need before you start
The guide assumes a Linux server with Docker Engine and the Compose plugin. I tested it on an 18-core arm64 Linux VM (OrbStack on Apple silicon) with Docker 29.5.2 and Compose v2.40.3, shared with other jobs. You also need:
- Outbound access to
ghcr.ioto pull the image - UDP access to port 53 of a public resolver if you use the DNS checks
- A free port for the dashboard; this guide uses 8080 bound to
127.0.0.1
How to install Gatus with Docker Compose
Create a directory with three pieces: compose.yaml, a config/ folder with the Gatus YAML and a hook/ folder with the alert receiver. This compose.yaml starts Gatus plus three test services (nginx, Redis and the receiver):
services:
  gatus:
    image: ghcr.io/twin/gatus:v5.37.0
    restart: unless-stopped
    ports:
      - "127.0.0.1:8080:8080"
    environment:
      GATUS_CONFIG_PATH: /config
    volumes:
      - ./config:/config:ro
      - gatus-data:/data
  webapp:
    image: nginx:1.30.1-alpine
  cache:
    image: redis:8.6.3-alpine
  hook:
    image: python:3.12-alpine
    command: ["python", "-u", "/hook/receiver.py"]
    volumes:
      - ./hook:/hook:ro
volumes:
  gatus-data:
Mount the whole config/ folder, not a single file. The README warns that the hot reload may miss changes when you bind the file directly, and a mounted folder lets you split the configuration into four or more YAML files. In my lab the container names carried a prefix and the dashboard sat on another port because 8080 was taken; everything else is identical.
The alert receiver is a 20-line HTTP server that prints each POST with the time. Save it as hook/receiver.py:
from datetime import datetime, timezone
from http.server import BaseHTTPRequestHandler, HTTPServer

class Hook(BaseHTTPRequestHandler):
    def do_POST(self):
        size = int(self.headers.get("Content-Length", 0))
        body = self.rfile.read(size).decode()
        now = datetime.now(timezone.utc).strftime("%H:%M:%S")
        print(f"{now} {body}")
        self.send_response(204)
        self.end_headers()

    def log_message(self, *args):
        pass

HTTPServer(("0.0.0.0", 9000), Hook).serve_forever()
I meant to send the alerts to an ntfy server in Docker, but Docker Hub answered 429 Too Many Requests when I pulled its image during the test. The Gatus ntfy provider takes alerting.ntfy.url and alerting.ntfy.topic; I did not run that path.
How to set up persistence and the alert
The config/config.yaml file defines where history is stored and who gets alerted. Without the storage block, Gatus keeps results and events in memory and loses them on every restart:
storage:
  type: sqlite
  path: /data/gatus.db

alerting:
  custom:
    url: "http://hook:9000/gatus"
    method: "POST"
    body: |
      {"state": "[ALERT_TRIGGERED_OR_RESOLVED]",
       "endpoint": "[ENDPOINT_GROUP]/[ENDPOINT_NAME]",
       "errors": "[RESULT_ERRORS]"}
    default-alert:
      failure-threshold: 3
      success-threshold: 2
      send-on-resolved: true
The custom provider sends an HTTP request to any URL and fills in the bracketed placeholders. default-alert saves you from repeating thresholds on every endpoint: three failures in a row open an incident and two successes close it. The first two values match the defaults, but send-on-resolved is off out of the box, and without it you never get the recovery notice.
On startup the log lists the configured and the ignored providers. On v5.37.0 it showed custom plus 40 others, among them Slack, Telegram, ntfy, Matrix, PagerDuty and Gotify.
How to define the HTTP, TCP and certificate checks
Each endpoint has a URL, an interval and a list of conditions. If a single one fails, Gatus marks the endpoint as down. Save this as config/endpoints.yaml (the group names and the description are in Spanish, as they ran in my lab):
endpoints:
  - name: webapp
    group: interno
    url: "http://webapp/"
    interval: 10s
    conditions:
      - "[STATUS] == 200"
      - "[BODY] == pat(*Welcome to nginx*)"
      - "[RESPONSE_TIME] < 500"
    alerts:
      - type: custom
        description: "nginx no responde"
  - name: redis
    group: interno
    url: "tcp://cache:6379"
    interval: 30s
    conditions:
      - "[CONNECTED] == true"
  - name: jacar-tls
    group: externo
    url: "https://jacar.es/"
    interval: 1h
    conditions:
      - "[STATUS] == 200"
      - "[CERTIFICATE_EXPIRATION] > 336h"
The webapp check tests the status code, that the body contains the nginx welcome text and that the response takes under 500 ms. The tcp:// prefix turns redis into a connection test: [CONNECTED] == true only proves that something listens on the port, not that Redis answers correctly. The third check fails when the certificate has less than 14 days (336 hours) left; the jacar.es one expires on 10 December 2026.
Only webapp has alerts. An endpoint without that list shows up on the dashboard but never alerts, even when a default-alert exists.
How to watch SPF and DMARC with the new DNS TXT check
v5.37.0 adds TXT to the DNS query types, according to the Gatus 5.37.0 release notes[2] (PR #1679). It catches someone deleting or changing your domain’s SPF record or DMARC policy. That failure breaks no website: you find out when your mail goes to the spam folder. Save this as config/dns.yaml:
endpoints:
  - name: spf
    group: correo
    url: "1.1.1.1"
    interval: 15m
    dns:
      query-name: "jacar.es"
      query-type: "TXT"
    conditions:
      - "[DNS_RCODE] == NOERROR"
      - "[BODY] == pat(*v=spf1 *-all*)"
  - name: dmarc
    group: correo
    url: "1.1.1.1"
    interval: 15m
    dns:
      query-name: "_dmarc.jacar.es"
      query-type: "TXT"
    conditions:
      - "[DNS_RCODE] == NOERROR"
      - "[BODY] == pat(v=DMARC1; p=reject*)"
The url of a DNS check is the resolver, not the domain. A domain can hold more than one TXT record: jacar.es has four, three Google verification strings and the SPF. Reading the Gatus DNS client code[3], I confirmed that v5.37.0 joins every TXT answer with a newline in [BODY]. That is why the SPF pattern starts and ends with *: without the leading one, the check would fail depending on answer order.
The same code shows a difference from the other types: for A, MX or NS, [BODY] keeps only the last answer. If a domain has two A records, a [BODY] == 203.0.113.10 condition can fail depending on the order the resolver replies in.
How to start Gatus and confirm it loads the configuration
Start the stack from the project directory and read the Gatus log:
docker compose up -d
docker compose logs gatus | grep -E "Reading|Validated|success"
On my start the log showed the three file reads, Validated 5 endpoints and one line per check with success=true, except one I cover under the limitations. The dashboard is at http://127.0.0.1:8080 and the API at /api/v1/endpoints/statuses, which returns each result with its evaluated conditions.
To test the hot reload, I edited endpoints.yaml with Gatus running. Gatus checks the files every 30 s, so a change takes up to 30 s to apply. In five tests, Configuration file has been modified appeared 10.3 to 14.1 s after saving (median 14.0 s). The service was back in 1.0 s, without restarting the container.
Then I restarted the container with docker compose restart gatus: the webapp endpoint kept its 19 results and 4 events, which stay in gatus.db on the volume.
What happens when a service goes down
To see the full cycle I stopped and restarted nginx with docker stop five times, with a 1-minute load average below 1.7. The alert arrived after a median of 30.0 s (28.7 to 30.0 s) and the resolved notice 19.9 s after nginx started. These are the lines the receiver printed in the first round:
17:58:02 {"state": "TRIGGERED",
 "endpoint": "interno/webapp",
 "errors": "Get \"http://webapp/\": dial tcp: lookup webapp
 on 127.0.0.11:53: no such host"}
17:58:22 {"state": "RESOLVED",
 "endpoint": "interno/webapp",
 "errors": ""}
The error is not a timeout but no such host: once the container stops, Docker’s internal DNS no longer resolves its name. The interval and the thresholds set those times, not the machine. The alert goes out with the third failed check, 20 to 30 s after the outage depending on where in the interval it happens, and the resolution with the second passing check.
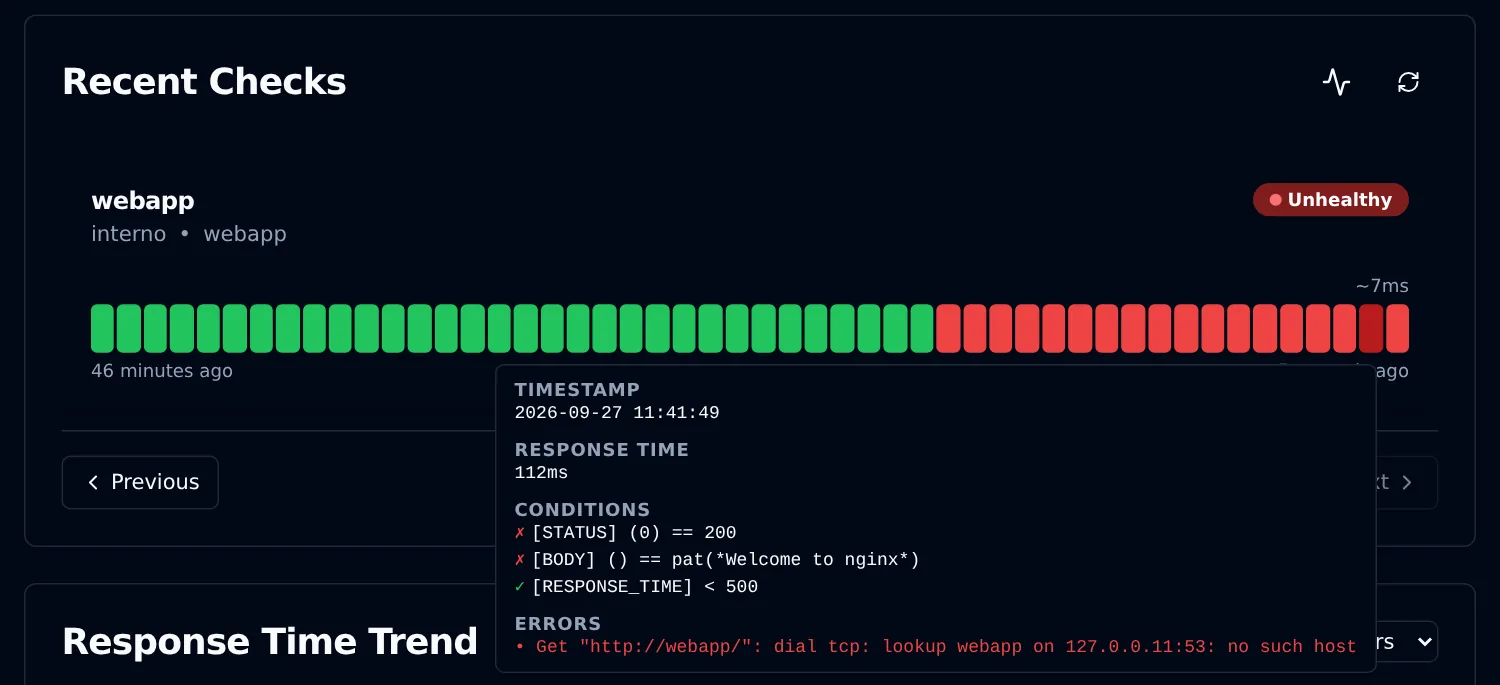
On the dashboard each bar is one check. Hover over a red one and Gatus shows which condition failed and with what value: [STATUS] (0) == 200 means there was no HTTP response at all.
How to validate the configuration before you commit
An error in a hot-reloaded file does not stay a warning. I changed TXT to TXTX on purpose and Gatus died with this message and exit code 2:
panic: error parsing config: invalid endpoint correo_spf:
invalid query type in the DNS configuration
With restart: unless-stopped, Docker restarted it eight times in a loop until I fixed the file. History survived because it was in SQLite, but the dashboard and the alerts were down the whole time. The README offers skip-invalid-config-update: true to keep the previous configuration, and warns that the next restart then fails anyway.
The image ships no validation command, so I use the startup itself as the test. This command runs Gatus with no network and /data in memory for 8 s:
timeout 8 docker run --rm --network none --tmpfs /data \
  -e GATUS_CONFIG_PATH=/config -v "$PWD/config:/config:ro" \
  ghcr.io/twin/gatus:v5.37.0 >/dev/null 2>&1
echo $?
A valid configuration returns 124, because timeout stops a process that was still alive; the broken one returns 2. --network none keeps the test from sending real alerts, and --tmpfs /data is required because without it SQLite cannot create the database and startup fails with unable to open database file (14). Put it in a pre-commit hook or your CI and broken YAML never reaches the server.
Limitations I hit during the test
Three things did not work as expected or deserve a warning before you run Gatus in production:
- Expiry of .es domains: the
[DOMAIN_EXPIRATION] > 720hcondition on jacar.es resolved to-2562047h47m16sand marked the endpoint as down. Gatus queries RDAP and falls back to WHOIS; the IANA RDAP registry[4] has no.esentry. I removed the condition;.comand.orgdomains do have RDAP. - Open dashboard: the
securitysection is empty by default, so anyone who reaches the port sees your services and their URLs. Setsecurity.basicwith a bcrypt hash orsecurity.oidc, or put Gatus behind an authenticating proxy. - Single vantage point: if the server running Gatus goes down, nobody alerts you. Run it on a different machine from the one it watches.
Gatus or Uptime Kuma: which one to pick
Both watch availability and send alerts; they differ in workflow and footprint. To measure memory I ran Uptime Kuma 2.5.5 on the same network with the same five checks: HTTP keyword, TCP port, HTTPS and two DNS TXT queries. I restarted both containers, waited 5 minutes and took 12 samples with docker stats, one every 30 s:
| Criterion | Gatus v5.37.0 | Uptime Kuma 2.5.5 |
|---|---|---|
| Configuration | YAML files | Web forms |
| Version control in git | Direct | Copy the database |
| Local image (arm64) | 24.4 MB | 602.8 MB |
| Median RAM, 5 checks | 25 MiB (11 to 35) | 123 MiB (115 to 146) |
| Minimum interval | No fixed minimum | 20 s |
| Alert channels | 41 providers | 90+ services |
| Conditions on the response | Body, JSONPath, IP, time | Keyword, JSON, DNS conditions |
| Status pages | The dashboard itself | One or more, custom domain |
The 1-minute load average stayed between 0.3 and 1.5 during the samples. Gatus memory jumps between two levels, 11 to 17 MiB and 32 to 35 MiB, and its median sits between them. Even so, Uptime Kuma used about 5 times more. The Uptime Kuma channel count and interval come from its README on GitHub[5].
Pick Gatus if you already manage infrastructure as code, want every monitoring change reviewed in a pull request or need conditions on an API response body. Pick Uptime Kuma if other people will add monitors without touching files, or if you want public status pages on your own domain. For server CPU and disk metrics neither is enough: pair it with Beszel in Docker or Prometheus in Docker.
Frequently asked questions
Can Gatus use PostgreSQL instead of SQLite?
Yes. Set storage.type to postgres and put the connection URL in storage.path, in the form postgres://user:password@host:5432/gatus. According to its release notes, v5.36.0 added indexes that make PostgreSQL about 15 times faster.
Does Gatus restart failing containers?
No. Gatus watches and alerts, but it does not act on Docker. For automatic restarts use Docker Compose healthchecks and restart policies, or point a custom alert at a service of yours that performs the restart.
Can I monitor services Gatus cannot reach over the network?
Yes, with external-endpoints: the remote service pushes its result to the Gatus API with a token, instead of Gatus polling it.
Conclusion
Gatus v5.37.0 fits in a 24.4 MB image, is configured with four YAML files and, in my test, detected and resolved a real outage with webhook alerts. The new DNS TXT check covers a gap that few monitors watch, the SPF and DMARC records. In exchange, broken YAML kills the process and domain expiry does not work for .es domains.
The next step is to put the config/ folder in git, add the timeout validation to your CI and swap the test webhook for a real channel, such as an ntfy server or Telegram.
Sources: [1] Gatus v5.37.0 release notes[2], [2] Gatus README[1], [3] Gatus DNS client at v5.37.0[3], [4] IANA RDAP registry for domains[4], [5] Uptime Kuma releases[6], [6] Uptime Kuma README[5].
Sources
Source code
Access all the source code for this post on GitHub.
View on GitHub