oMLX benchmarks: measurement method and the memory ceiling
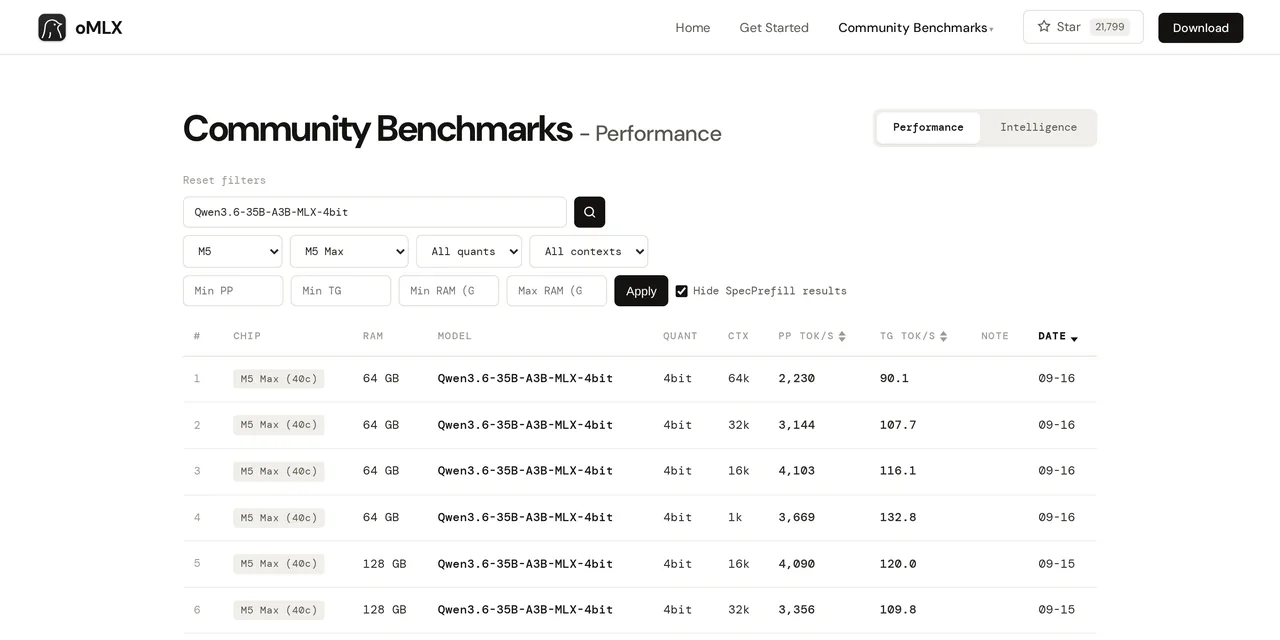
Table of contents
- Key takeaways
- The variables to pin down before measuring
- What each metric measures
- How speed changes with prompt length
- The built-in benchmark against the API
- Cold or warm cache, and concurrent requests
- The Mac's thermal state
- The memory ceiling decides first
- The two errors when it does not fit
- Frequently asked questions
- Why does the same model give different figures in the dashboard and in my client?
- What does "Prefill context too large for available memory" mean in oMLX?
- What does "does not fit under the memory ceiling" mean?
- How much context fits on my Mac?
- Are my oMLX benchmarks uploaded to omlx.ai?
- Conclusion
- Sources
An oMLX tokens-per-second figure means nothing unless it says which prompt length, which route, a cold or warm cache, and a cold or hot Mac. This article is the method we follow at jacar.es to measure oMLX, illustrated with our own results from a 128 GB Apple M5 Max. It also covers the memory ceiling, which decides before anything else whether a test fits, and the two errors you get when it does not.
Key takeaways
- Going from a 1,000 to a 32,000-token prompt, Qwen3.8-27B’s time to first token rose from 1.12 to 65.5 seconds and its decode fell from 30.6 to 23.5 tokens per second.
- The dashboard’s built-in benchmark and the API do not give the same figure for the same model: Qwen3.6-35B-A3B oQ4e-mtp generated 49.3 tokens per second in one and 100.2 in the other.
- The Mac’s temperature matters: the same gpt-oss-20b test with a 16,000-token prompt processed 2,942 tokens per second on a partly cold Mac and 1,755 on a hot one.
- The 0.7.2 built-in benchmark never reuses the prefix cache, and it uploads results to omlx.ai except in three specific cases.
- The default memory ceiling leaves 8 % of RAM for macOS, between 3 and 8 GB.
The variables to pin down before measuring
Each of these variables moves the numbers as much as switching models does. A comparable measurement fixes all of them and records them next to the result:
| Variable | What it changes | How we fix it |
|---|---|---|
| Prompt length | Time to first token grows with it; decode drops | We measure at 1k, 4k, 16k and 32k tokens, or with the task’s real context |
| Answer length | With short answers the start-up weighs more | 768 tokens through the API and 256 in the built-in benchmark |
| Concurrent requests | Total throughput rises and each request gets slower | A single request, unless we measure a shared server |
| Prefix cache | A warm cache skips recomputing the prompt | A unique prefix on every request, so we always measure cold |
| Mac thermal state | A hot Mac lowers its clocks | Compare only within one session and record thermal pressure |
| Measurement route | Engine, sampling and tokens differ between dashboard and API | Always state whether it is the built-in benchmark or the API |
| Version and acceleration | A new release or Lightning MTP changes the result | Store the oMLX version and the model settings with every measurement |
What each metric measures
A request has two phases, and each metric looks at one. Prefill processes the whole prompt at once; decode generates the answer token by token. These are the metrics we use:
| Metric | What it is | What makes it worse |
|---|---|---|
| TTFT | Time from sending to the first token | A long prompt, a cold cache, the first request after loading |
| Prefill | Prompt tokens processed per second | Large dense models and long prompts |
| Decode | Answer tokens generated per second | The size of the active weights, the accumulated context |
| Total time | From sending to the last token | The sum of both phases |
| Peak memory | The maximum MLX records, weights included | The model, the context and the batch |
Separating TTFT from decode explains the most. A model can take a minute to start on a long prompt and then generate at a good pace; if you only look at tokens per second, you never see that minute.
How speed changes with prompt length
Prompt length is the variable that moves time to first token the most. With a 32,000-token prompt, Qwen3.8-27B MLX-4bit took 65.5 seconds to start answering, 58 times longer than with 1,000:
Decode also drops with context, but less and unevenly. The mixture-of-experts Qwen3.6-35B-A3B lost 15 % between 1k and 32k; gpt-oss-20b, which started as the fastest, lost 45 %:
The practical consequence is to measure at the length you will use. A figure taken with 1,000 tokens says nothing about how the model behaves with a whole source file in context.
The built-in benchmark against the API
The oMLX dashboard ships a benchmark tool that measures prefill, decode, TTFT and peak memory with prompts from 1,024 to 200,000 tokens and batches of 2, 4 and 8 requests. It is the best tool to see how a model scales with context, but its figures are not what your client will see through the API:
On four models the built-in benchmark came out 13 % to 28 % above the API, because it generates shorter answers and always samples greedily. On Qwen3.6-35B-A3B oQ4e-mtp it came out at half. It is a vision model, and the benchmark loads it on the text engine unless MTP is on; the API uses the vision engine.
That is why we use the built-in benchmark for context curves within one model, and the API to compare configurations or models with each other. Through the API we time streaming requests to /v1/chat/completions from the client, with thinking off and a unique prefix per request.
Two details of the 0.7.2 benchmark tool affect how you read its results:
- It does not reuse the prefix cache. Every request starts with a random identifier, so it always measures the prompt cold.
- It uploads results to the omlx.ai leaderboard. Only tests with the prompt aligned to the Neural Engine (
align_prompt_to_ane), tests on the external Splash engine and tests of an external endpoint stay local.
Cold or warm cache, and concurrent requests
oMLX’s tiered KV cache changes TTFT and leaves decode as it is. When a request shares a prefix with an earlier one, the blocks are read from RAM or SSD instead of recomputed, even after a server restart.
The benchmark tool does not measure that case, because each test uses a fresh prefix. To measure it, send the same long request twice through the API and compare the time_to_first_token oMLX returns in usage. The first is your worst case, the first request of the day; the second, a conversation that carries on. We have not published that measurement for the M5 Max yet.
Batches of 2, 4 and 8 requests only matter if the server serves more than one client at a time. For one person in front of a coding assistant, the honest number is the single-request one.
The Mac’s thermal state
A Mac that has been under full load for a while lowers its clocks, and that changes results from one round to the next. In the same session on 15 September, gpt-oss-20b ran the battery twice: once at the start, with the Mac partly cold, and once at the end, hot.
With short prompts both rounds match; at 16,000 and 32,000 tokens the hot round processed 38 % to 40 % less. That is why we only compare configurations measured in the same session, and record thermal pressure when we capture it.
Across sessions the comparison is even shakier. On the local LLM benchmarks on Apple Silicon page, Qwen3.8-27B oQ4e-mtp with Lightning MTP went from 39.7 tokens per second on 15 September to 70.8 on 27 October. Between the two dates the oMLX version, the MLX libraries and the thermal state all changed, and there is no way to split the gain among the three.
The memory ceiling decides first
A Mac with unified memory has no separate video memory: every model comes out of the same budget as macOS and the other apps. oMLX enforces its own ceiling so the Mac does not run out of memory, and computes it from a tier:
safe: keeps 20 % of RAM free, between 6 and 16 GB.balanced: the default tier. Keeps 8 %, between 3 and 8 GB, and may compress a quarter of other apps’ active memory.aggressive: keeps 2 %, between 1.5 and 4 GB, and may compress half of it.custom: a fixed ceiling in GB, with--memory-guard-gbormemory_guard_custom_ceiling_gb.
On a 128 GB Mac, balanced leaves about 120 GB; on a 16 GB one, about 13 GB. The ceiling also moves: oMLX recomputes it from the memory free at each moment, so a heavy app left open lowers it. On the command line the tier is set with --memory-guard, which also accepts off.
What counts against the ceiling is not just the size of the model file. Peak memory grows with context, more for some models than others:
Qwen3.8-27B, a dense model, added 5.8 GiB between a 1k and a 32k prompt; gpt-oss-20b added 0.6 GiB. With batches of more than one request, the KV cache grows with every request added.
The two errors when it does not fit
The messages people run into come in two families, and they mean different things. The first shows up while a request is being processed:
Prefill context too large for available memory (pre-chunk
guard at ... tokens, kv_len=...): predicted peak would exceed
prefill safety cap ...
It comes from the prefill guard, which estimates the peak before processing each chunk of the prompt. The model fits, but that prompt with that model does not. The ways out are a shorter context, unloading another model to free memory, or raising the ceiling tier.
The second shows up when a model loads, and through the API it arrives as a 507:
Model '...' (...) does not fit under the memory ceiling (...).
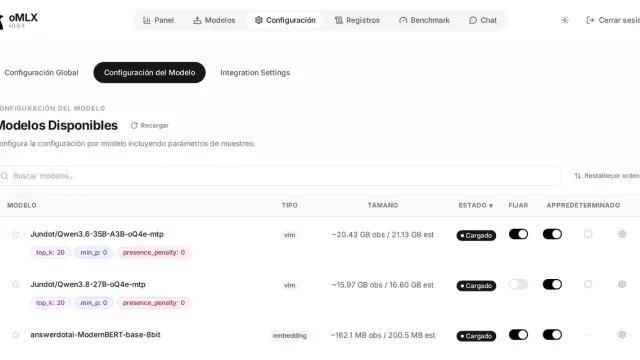
Here the problem is the whole model, even after evicting the ones that are not pinned. The ways out are a more aggressive quantisation, pinning fewer models or changing tier. Before touching the ceiling, check what is loaded and what is pinned, as I explain in model management and memory in oMLX.
Frequently asked questions
Why does the same model give different figures in the dashboard and in my client?
Because the built-in benchmark generates 256 tokens with greedy sampling and may load a vision model on the text engine, while your client uses the API with its own temperature and length. In our tests the gap was 13 % to 28 % on four models and half on one. Always compare configurations through the same route.
What does "Prefill context too large for available memory" mean in oMLX?
That the prefill guard estimates that processing that prompt would exceed the memory ceiling. The model is loaded and fits; what does not fit is that context. Shorten the prompt, unload another model or raise the tier with --memory-guard.
What does "does not fit under the memory ceiling" mean?
That the model you are loading takes more than the ceiling allows, even after evicting unpinned models. Through the API it arrives as a 507 error. Use a smaller quantisation, unpin models or change tier.
How much context fits on my Mac?
It depends on the ceiling, the model and how many requests you serve at once, so measure it. Run the built-in benchmark with growing prompt lengths and read each size’s peak memory; the prefill guard will reject the first one that does not fit.
Are my oMLX benchmarks uploaded to omlx.ai?
Yes, built-in benchmark results are uploaded when they finish. Tests with align_prompt_to_ane on, tests on the external Splash engine and tests of an external endpoint stay local.
Conclusion
Measuring oMLX well is mostly deciding what you are measuring. Pin down the prompt length, the route, the cache state and the session, and record them next to the result; without that, the figures are noise. Our measurements on a 128 GB M5 Max, with the full method and a downloadable CSV, are on the local LLM benchmarks on Apple Silicon page.
The memory ceiling sets the upper bound of everything else. The endpoints, the key and the error codes are in the oMLX API reference, and every guide, in order, on the oMLX page. The Spanish version of this article is Benchmarks de oMLX y techo de memoria.
Sources: [1] jundot/omlx, code of the v0.7.2 tag[1], [2] oMLX 0.7.2 release notes[2], [3] Local LLM benchmarks on Apple Silicon, the jacar.es dataset, [4] MLX, the Apple framework oMLX runs on[3], [5] vLLM and PagedAttention, the origin of the block cache[4].
Sources
Source code
Access all the source code for this post on GitHub.
View on GitHub